
This is the first post in a series of efficiency tests for our Rivian R1T. Up first: bikes and ski boxes. (Coming: ride height/drive modes, AT/winter tires, SUP… let me know in the comments what else I should test!) Stick around to the end of the post to find out why I may not have even needed to do this testing…
I completed this testing with the same methodology as for similar tests with my Model 3. For a summary though:
- I use a dedicated 1 mile (1.6km) segment of road for all the tests; it does have elevation change, so I run the tests both way to even that out (plus account for any light breeze) – this is the best we can do for a flat/straight road segment within hours of driving from our home since we live in a pretty narrow mountain valley
- I avoid testing on days with weather that is changing significantly (so never in rain/snow, light or no wind, etc)
- I put the HVAC in manual and leave the settings the same for the duration of the test
- I accelerate smoothly to the test speed, set cruise control, then the trip meter is reset once the vehicle has been at a steady speed for about 3 seconds
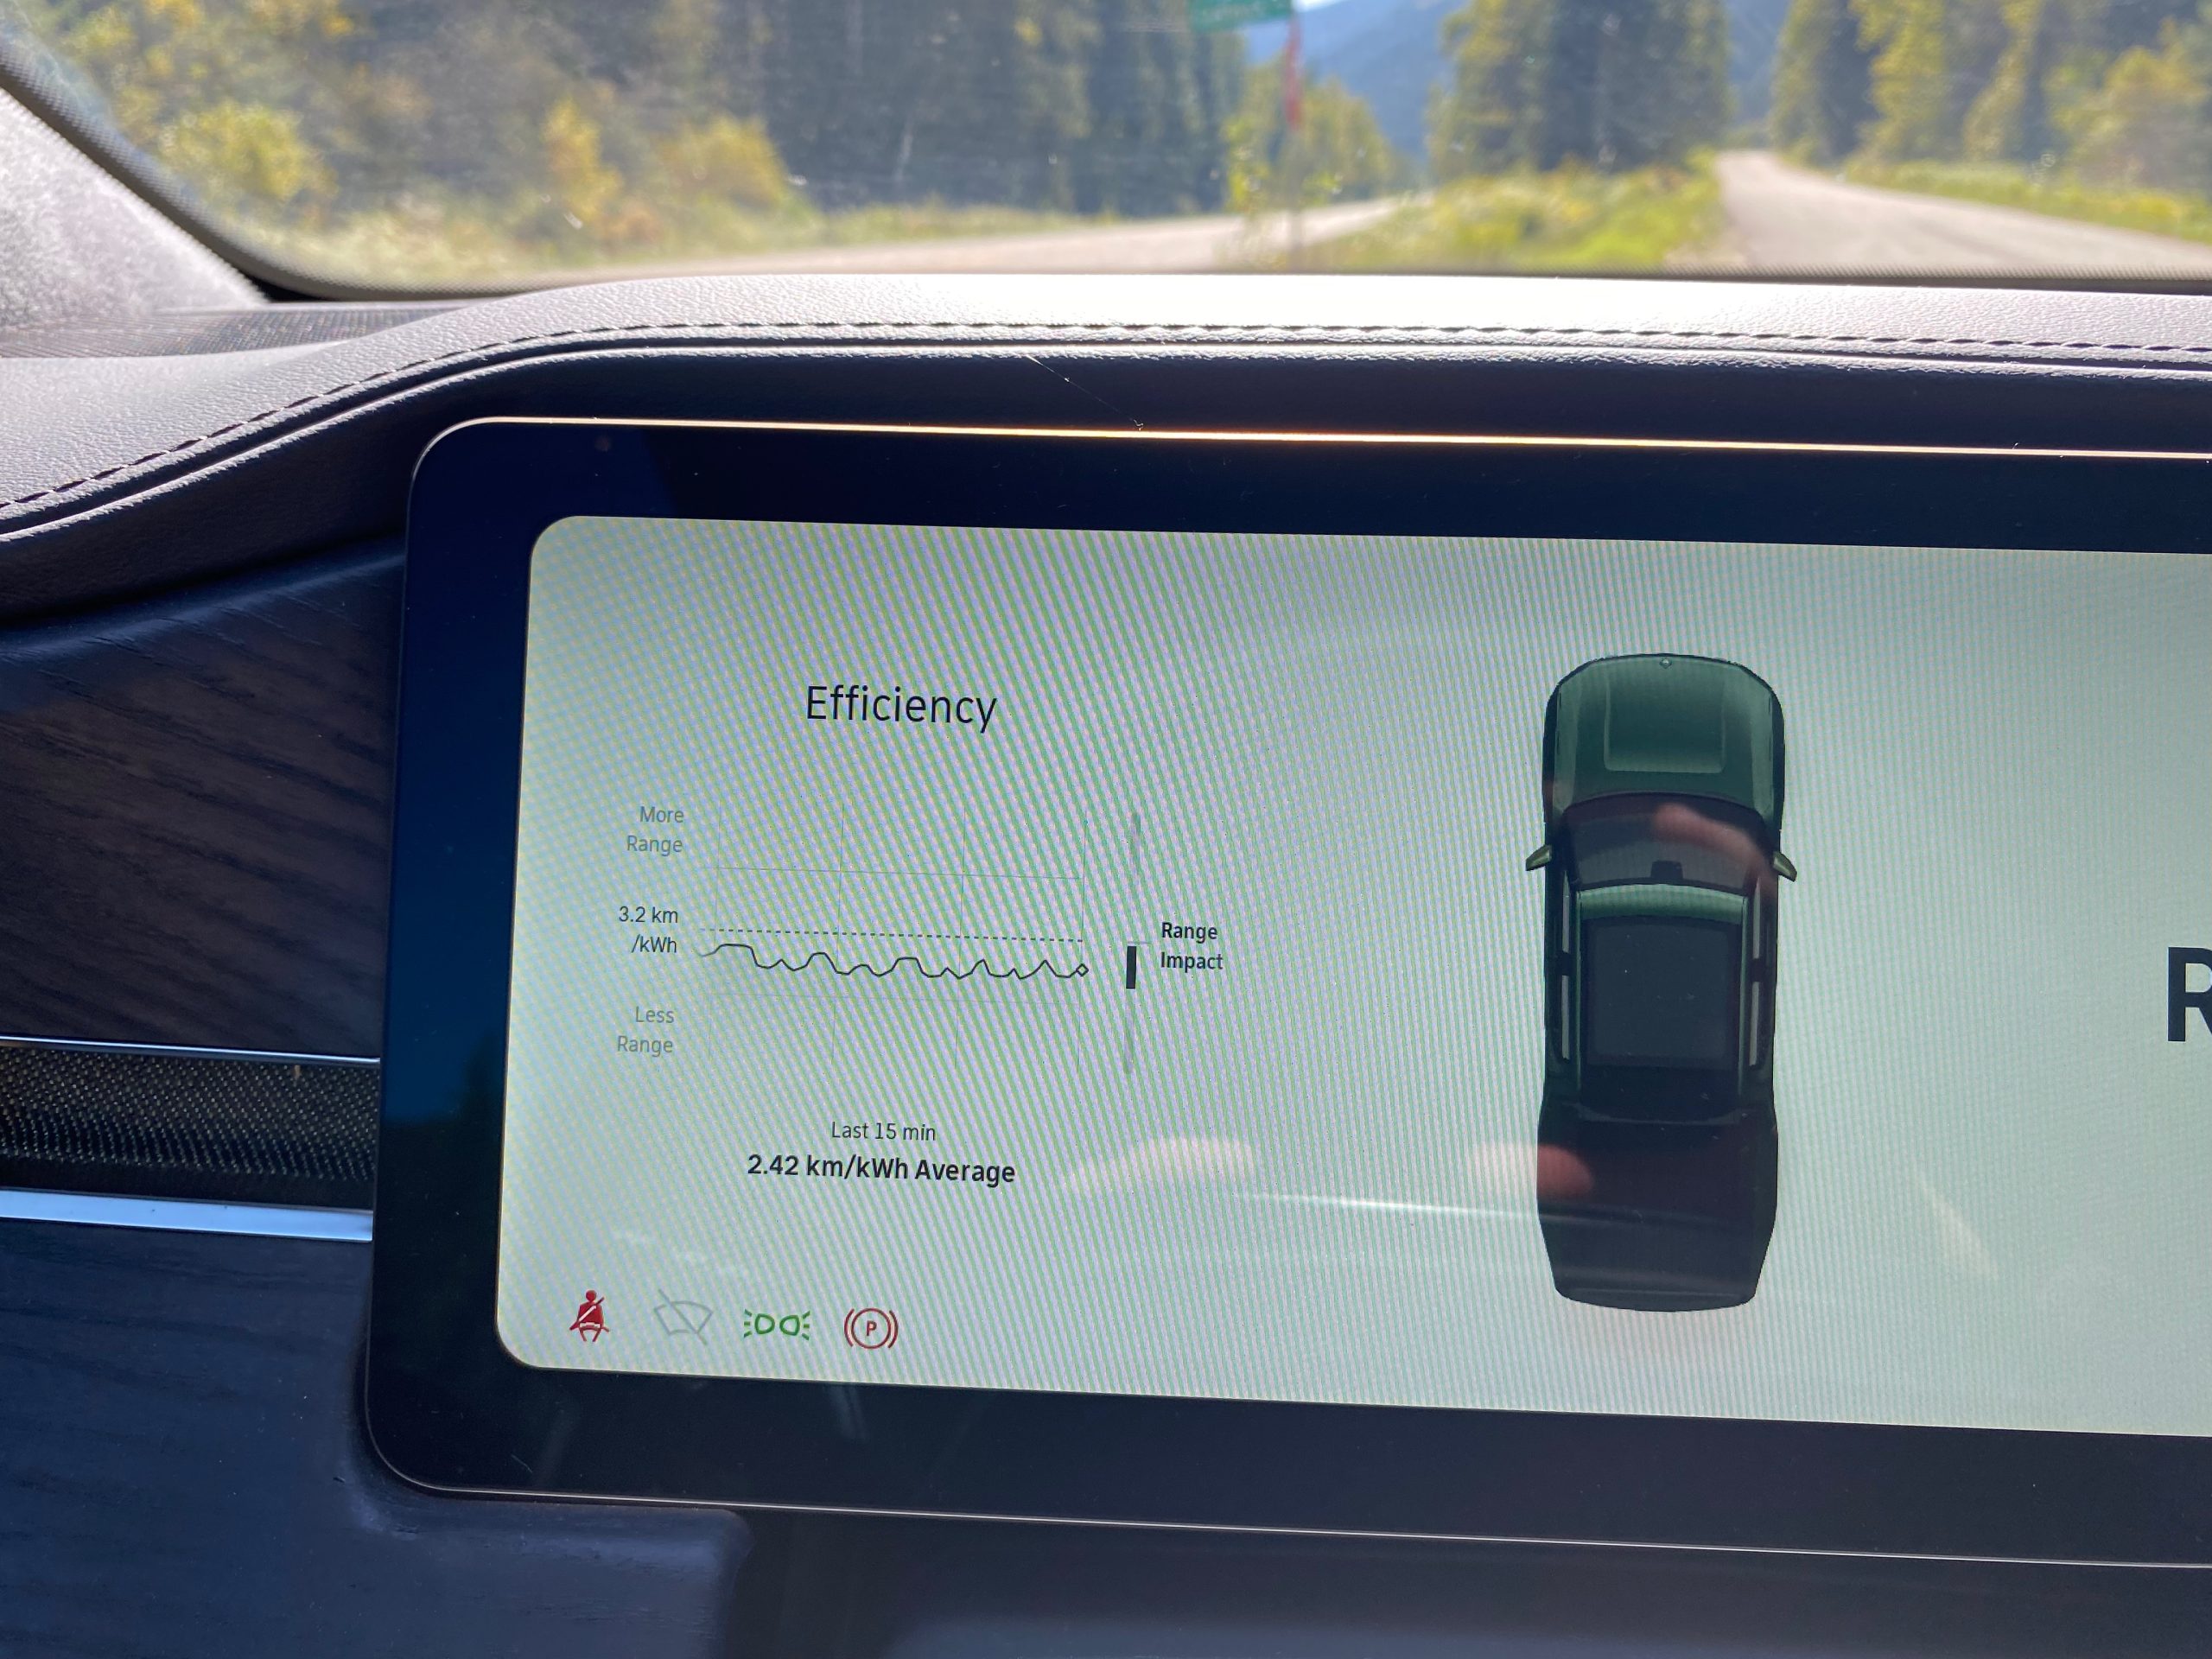
- At the end of the segment, prior to slowing down, I take note of the efficiency reading (in the Rivian, this is the “km/kWh” value) – in this way, we obtain the average consumption over a constant speed; this gets rid of the variability inherent in using a longer test loop where traffic or other conditions inevitably create change that is hard to account for
- I repeat the segment each way 2 to 3 times for a total of 4 – 6 times; I’ll stop at 2 times if the variance between runs is small (e.g. <0.2 km/kWh), sometimes I’ll run a 3rd if I have any doubts about a data point
- I average the runs and use that to compute the difference from whatever my base test was for the day
I avoid comparing one test day to another; I do collect some data that would help in making such comparisons, but I prefer to test back-to-back scenarios as much as possible to reduce variability. For this testing, it was completed at 110 km/h (to match with ABRP’s displayed efficiency speed); I think this represents highway testing for Canada particularly well, since most highways are 100 km/h and traffic commonly flows between 105 – 110 km/h. Those reading from the US travelling on interstates might find this a bit low. Because aerodynamics pretty much dominates at this speed, if you are travelling faster, the hit to efficiency will likely be higher (both in absolute terms and as a %), while those travelling slower on secondary roads (e.g. 90 km/h) will likely see the opposite.
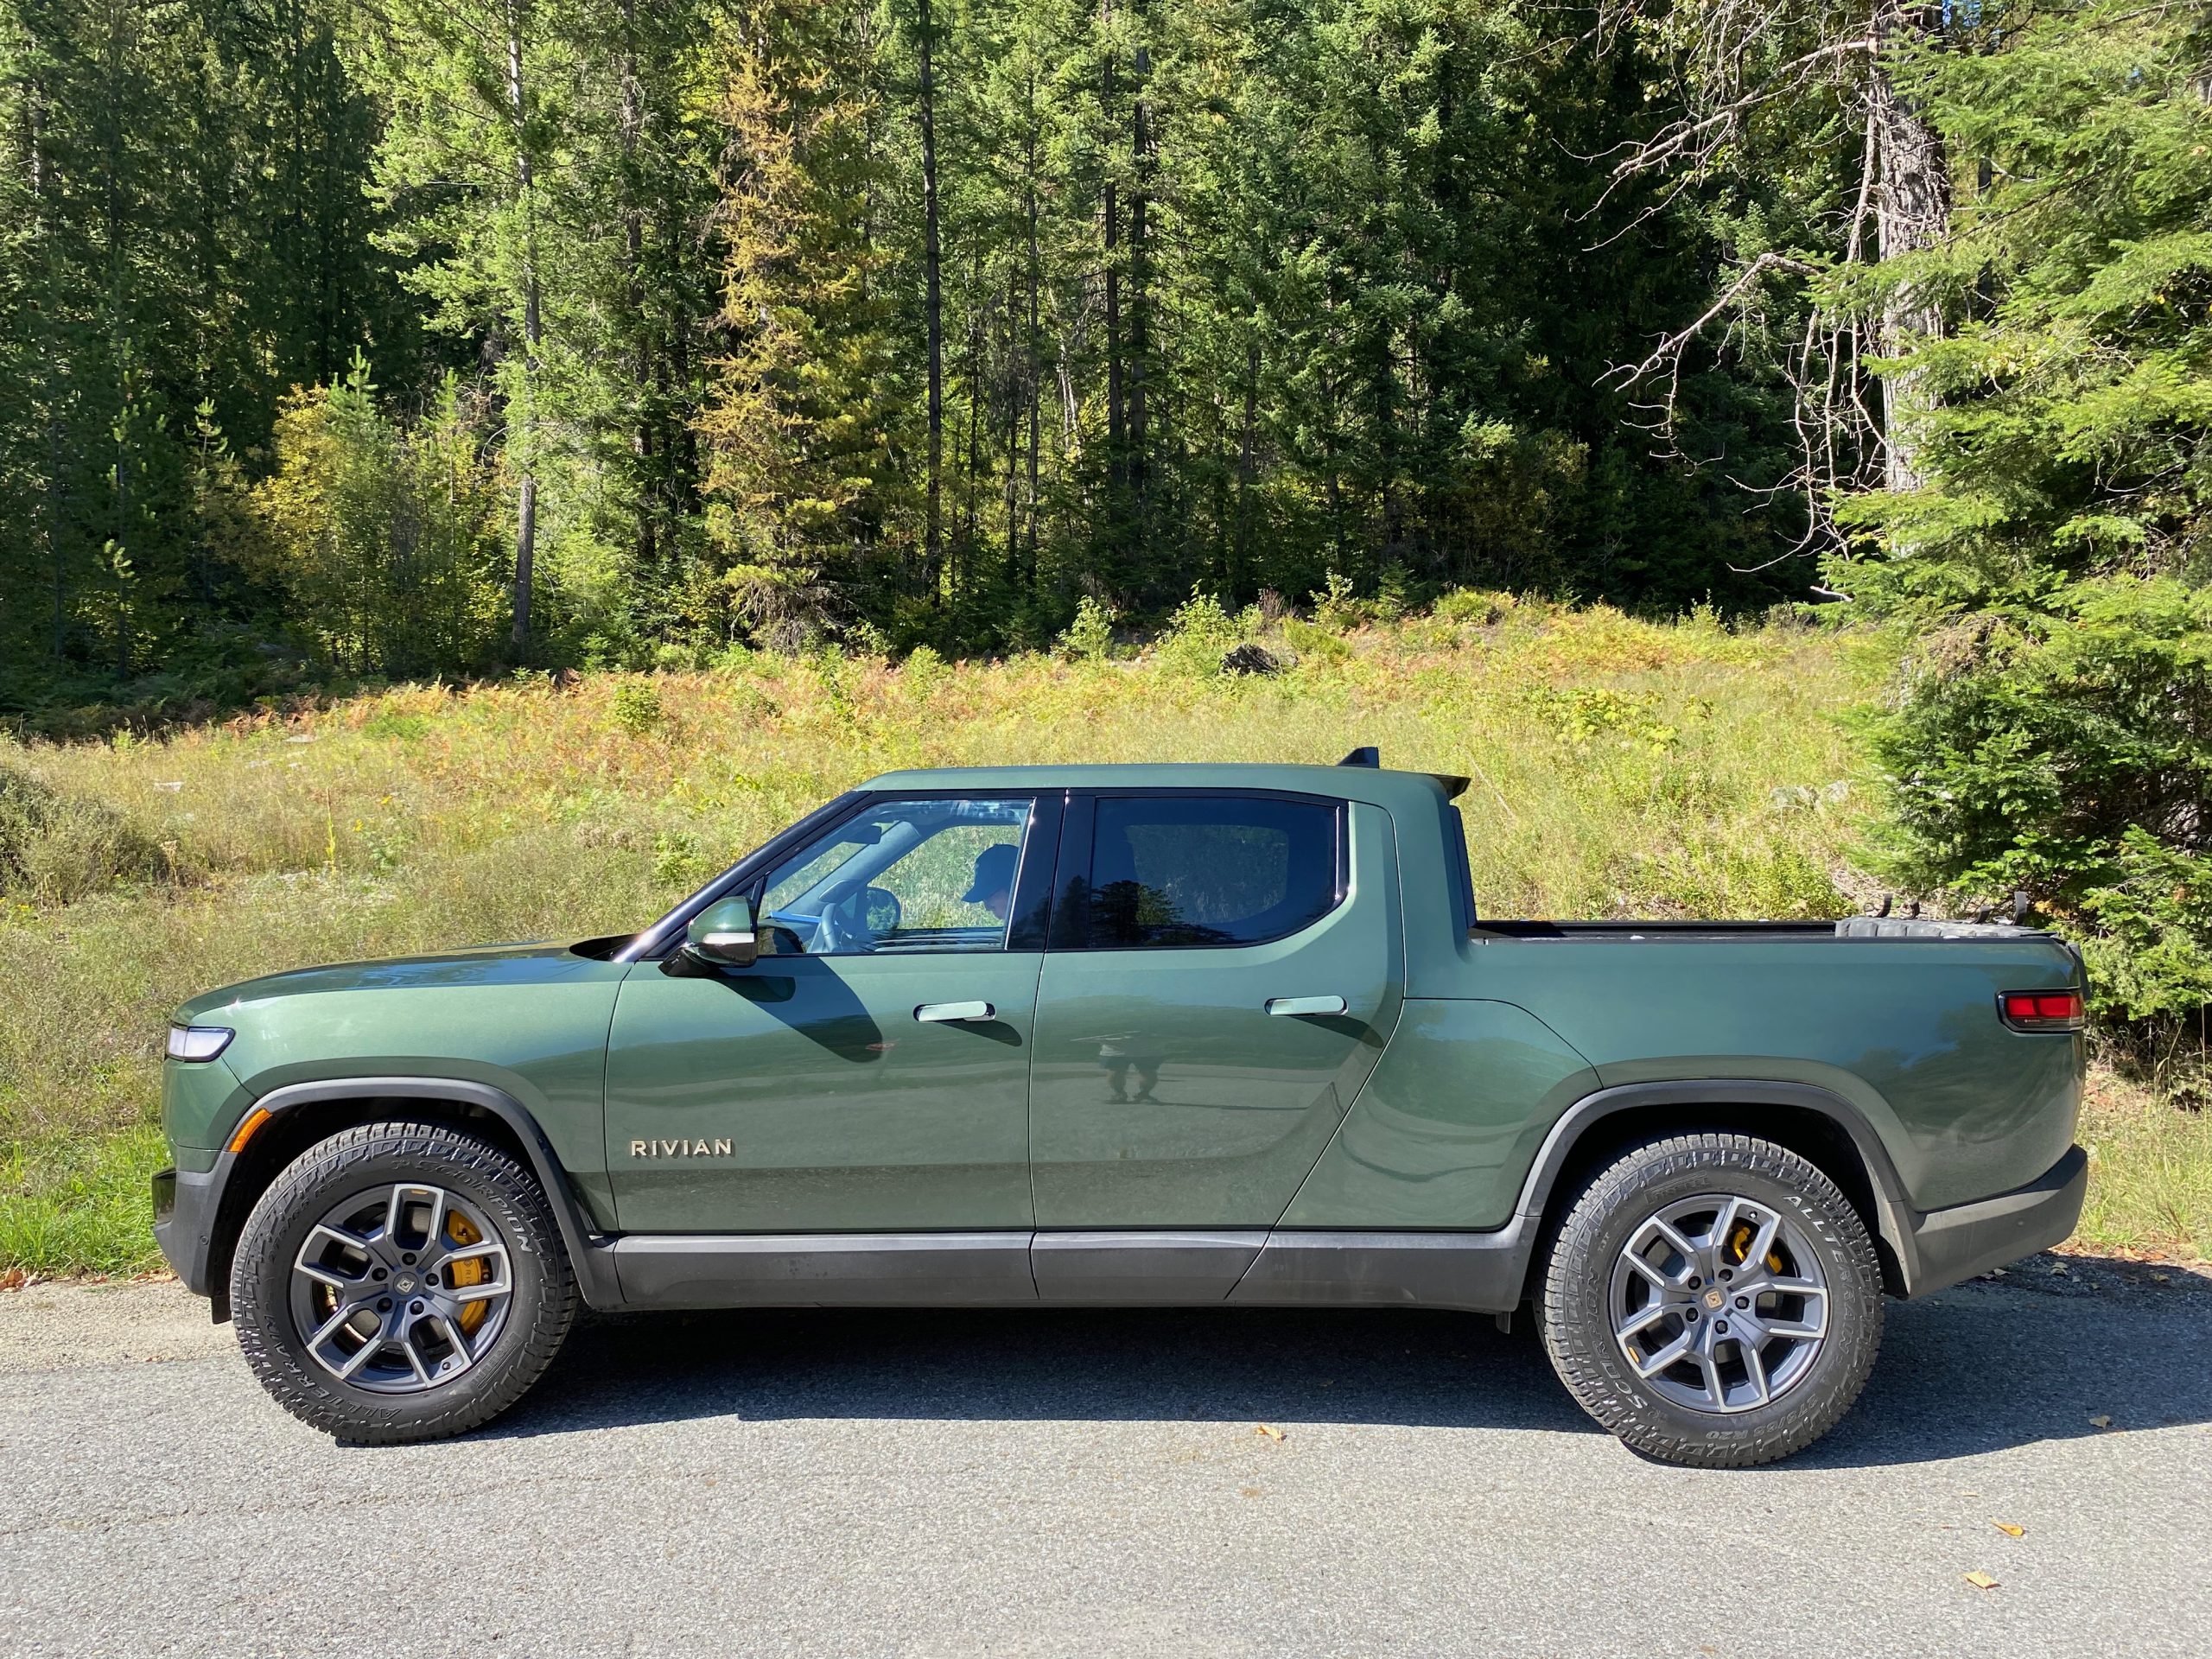
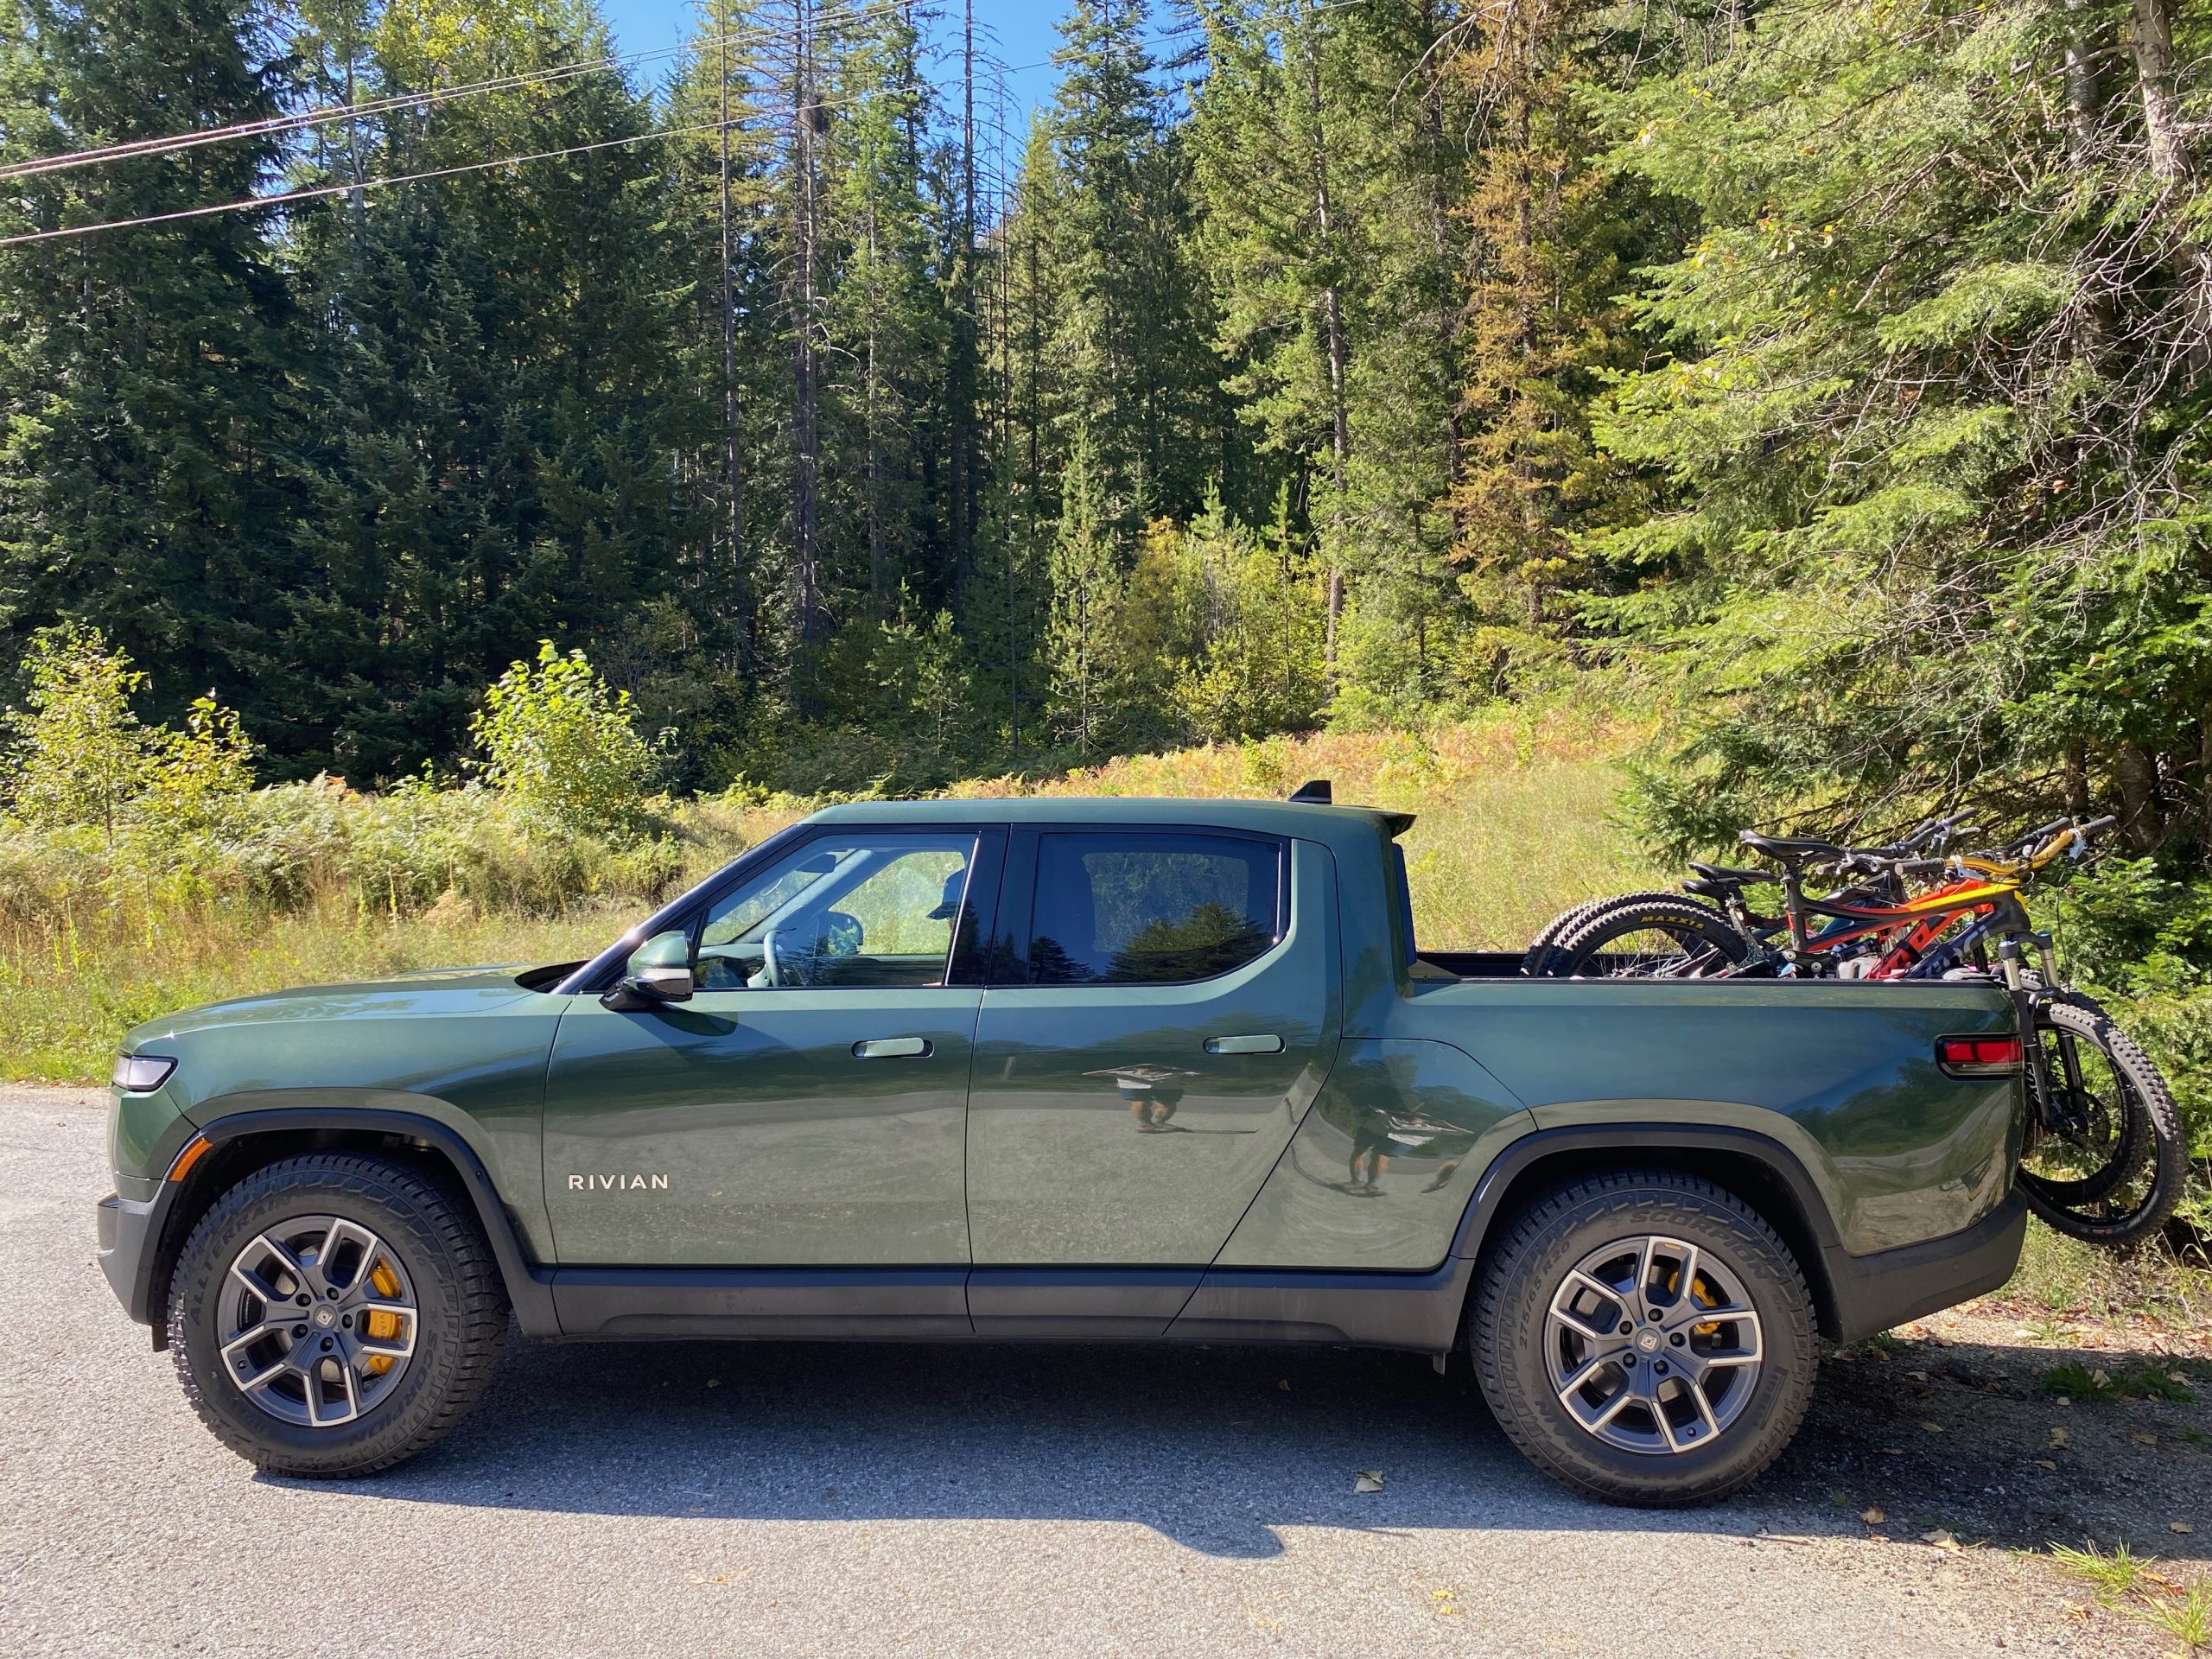
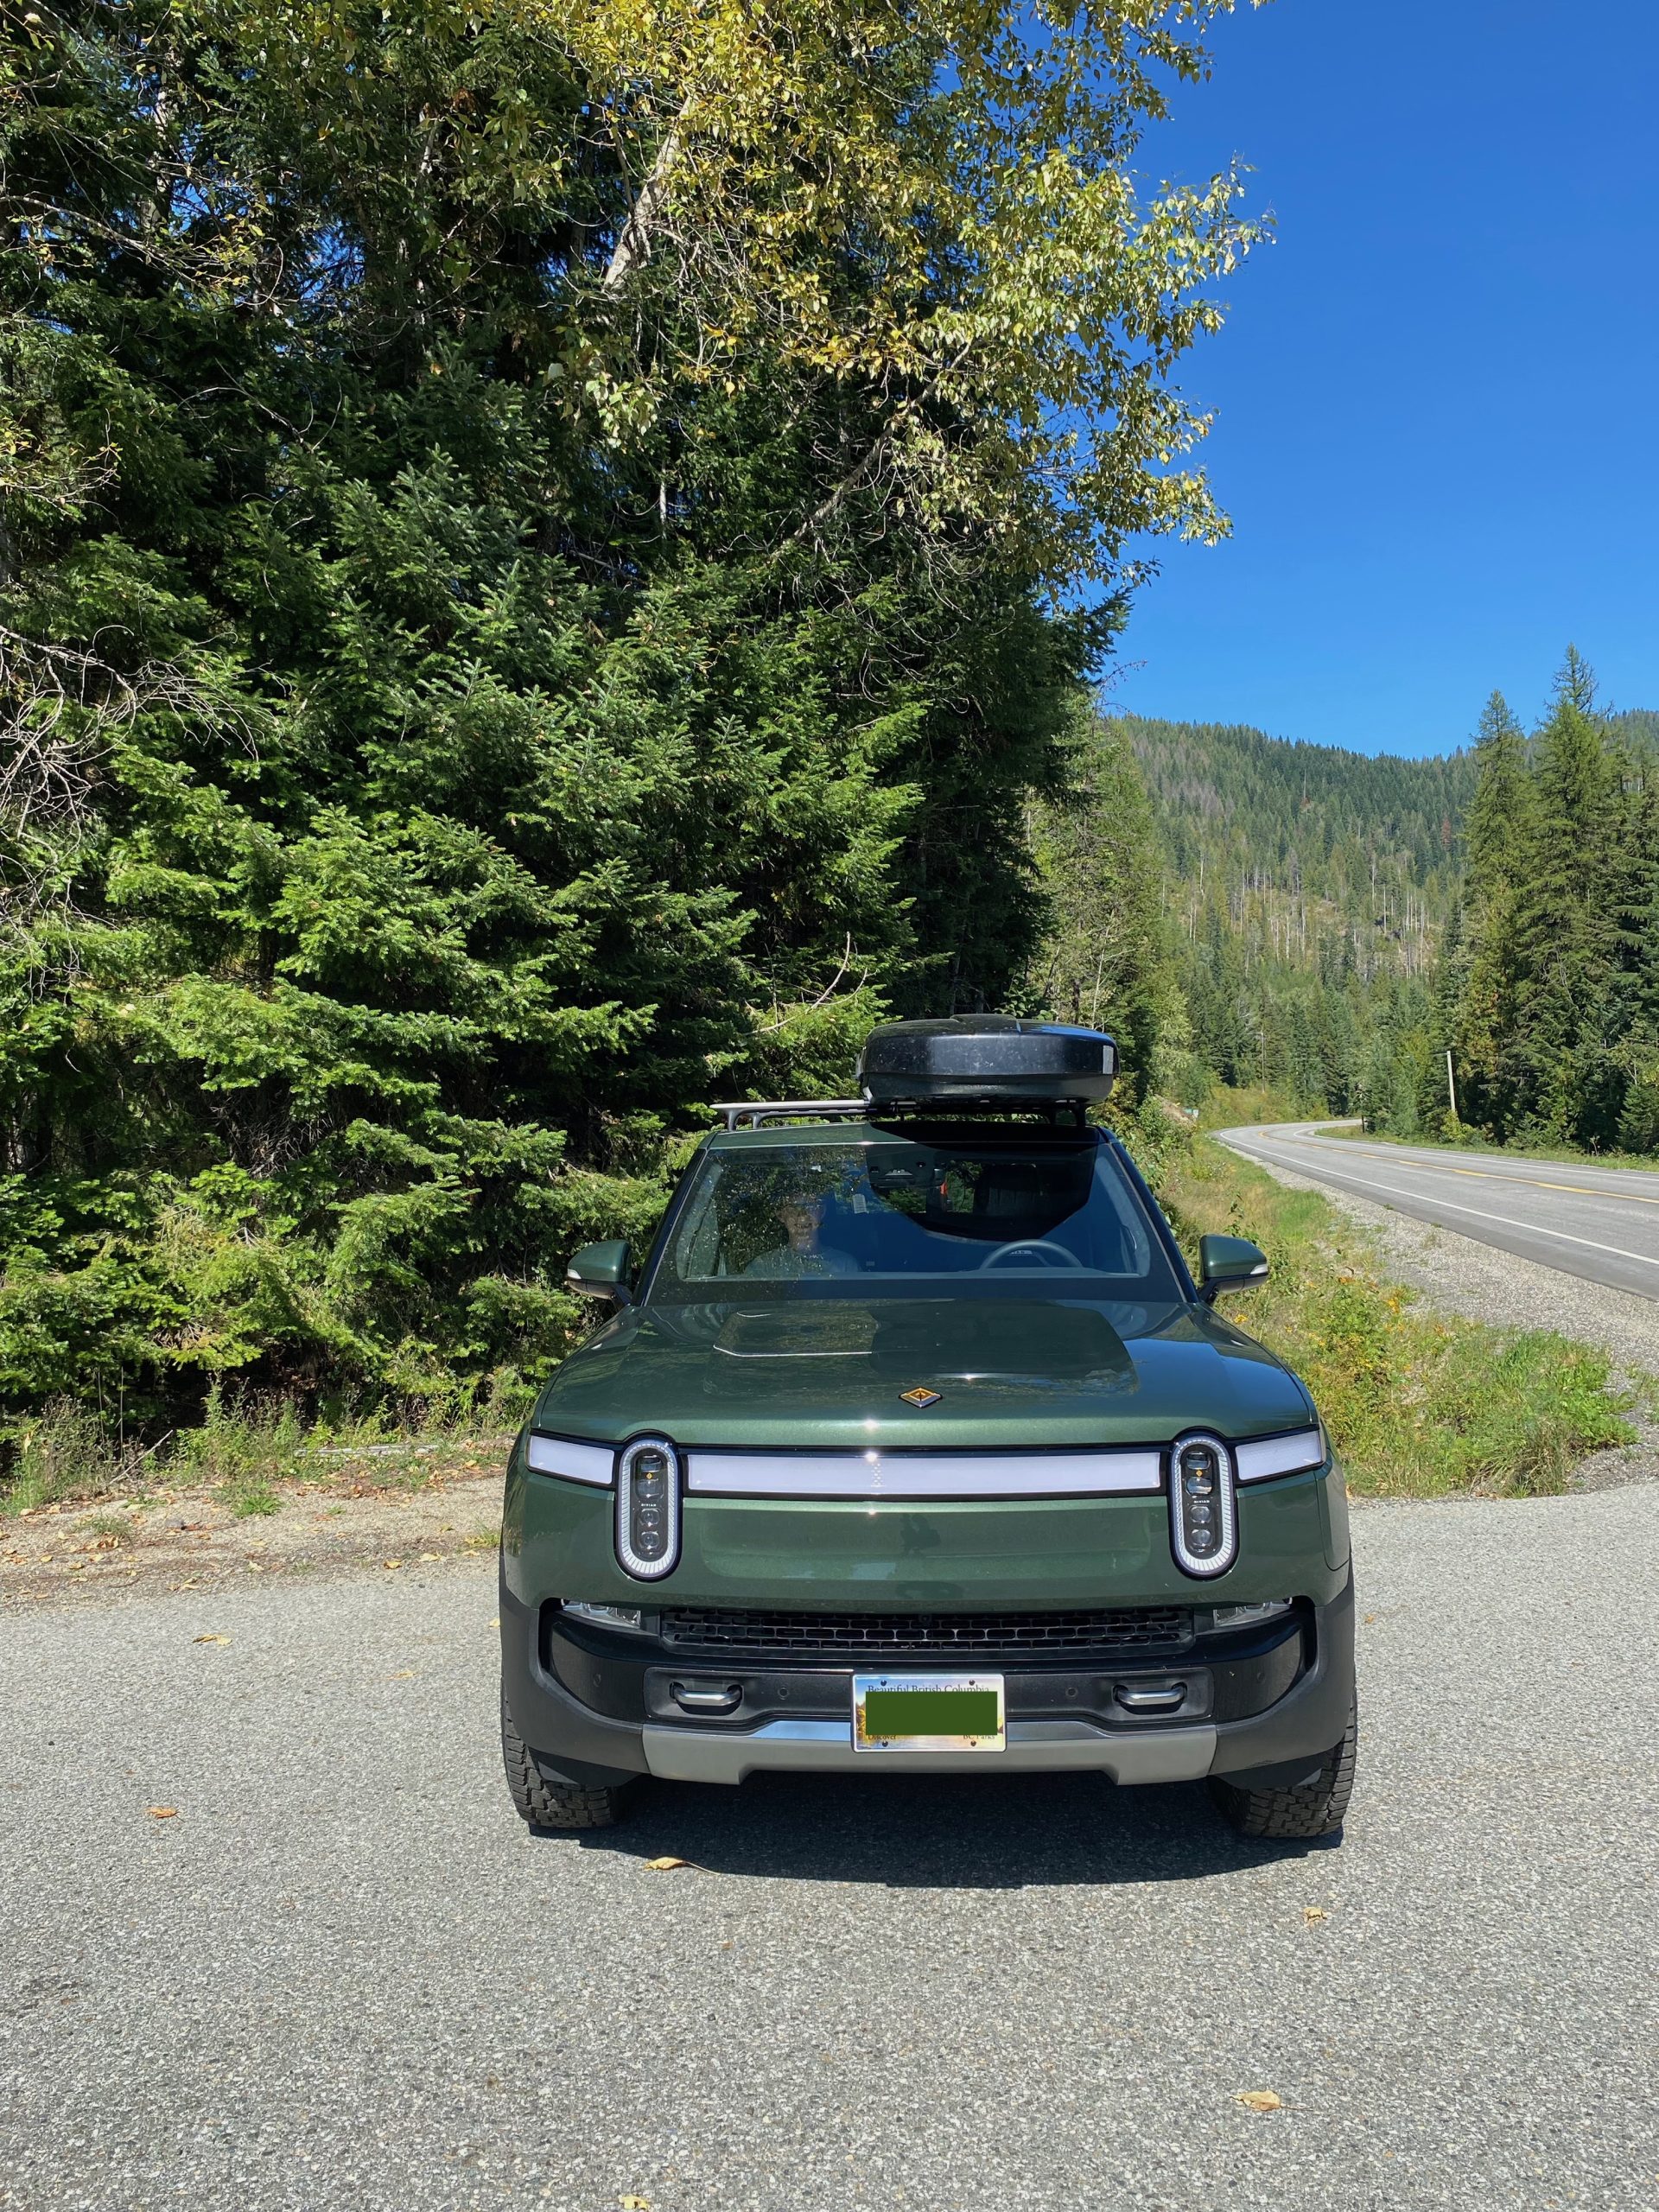
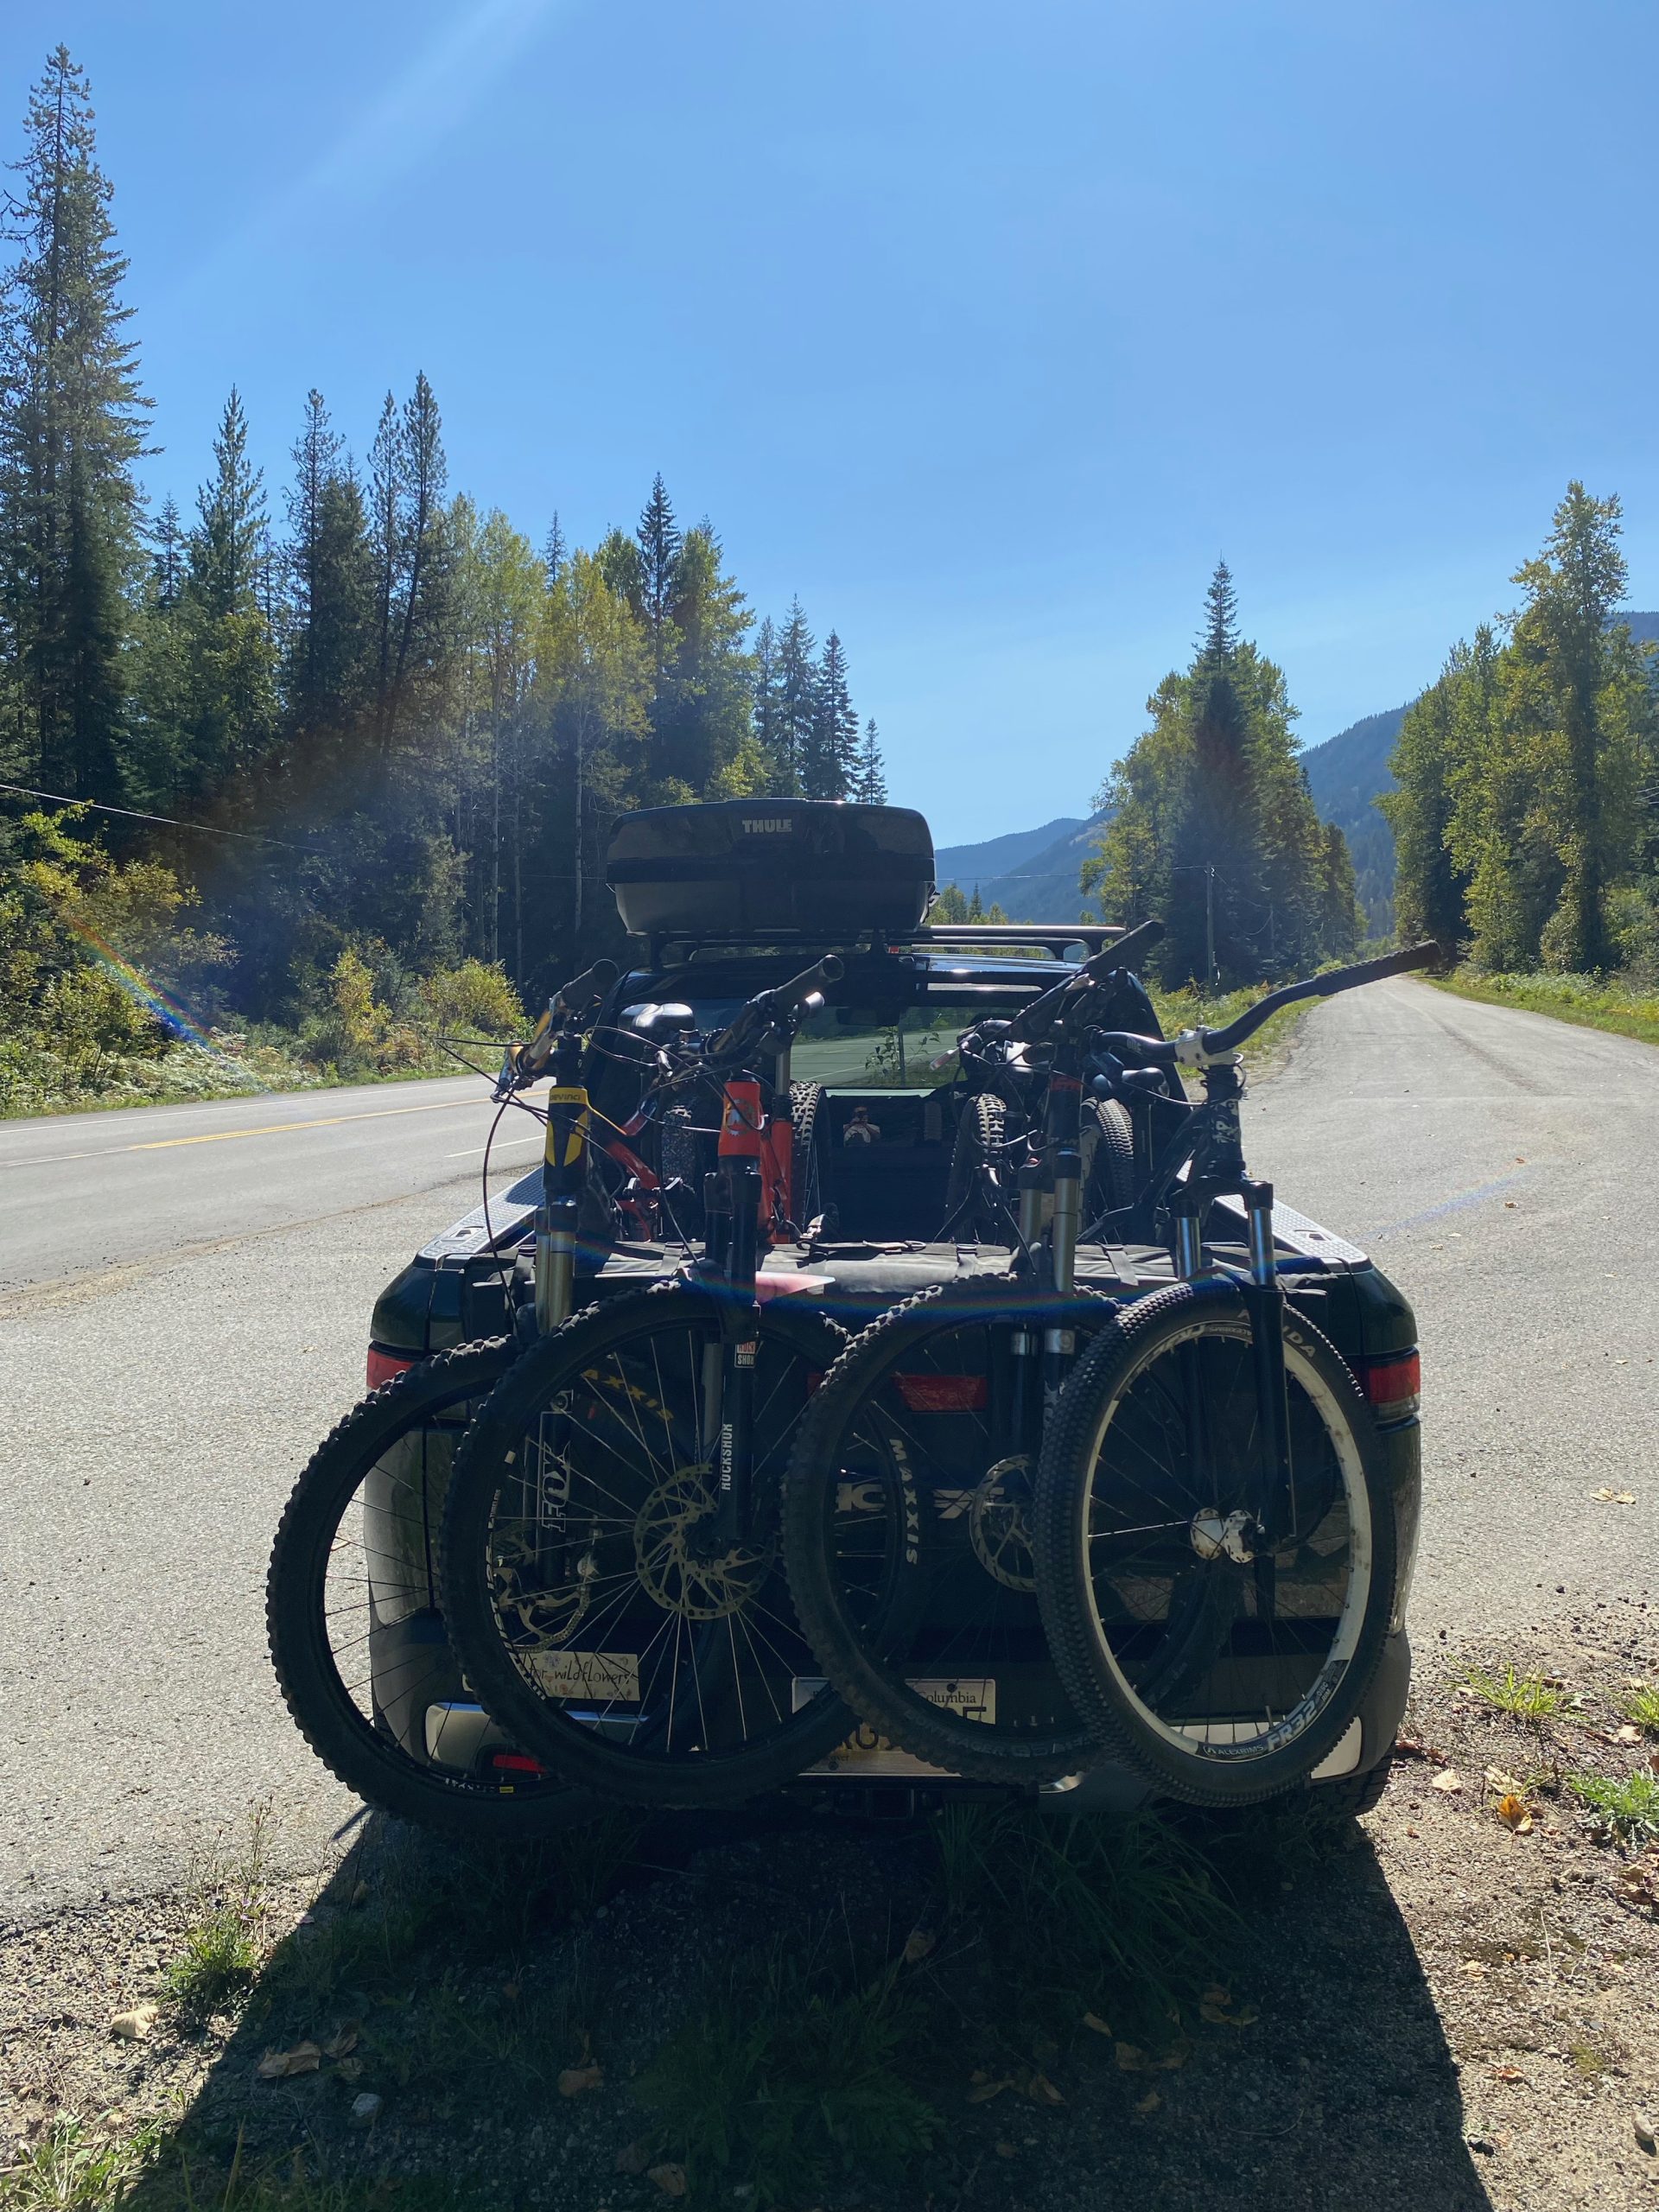
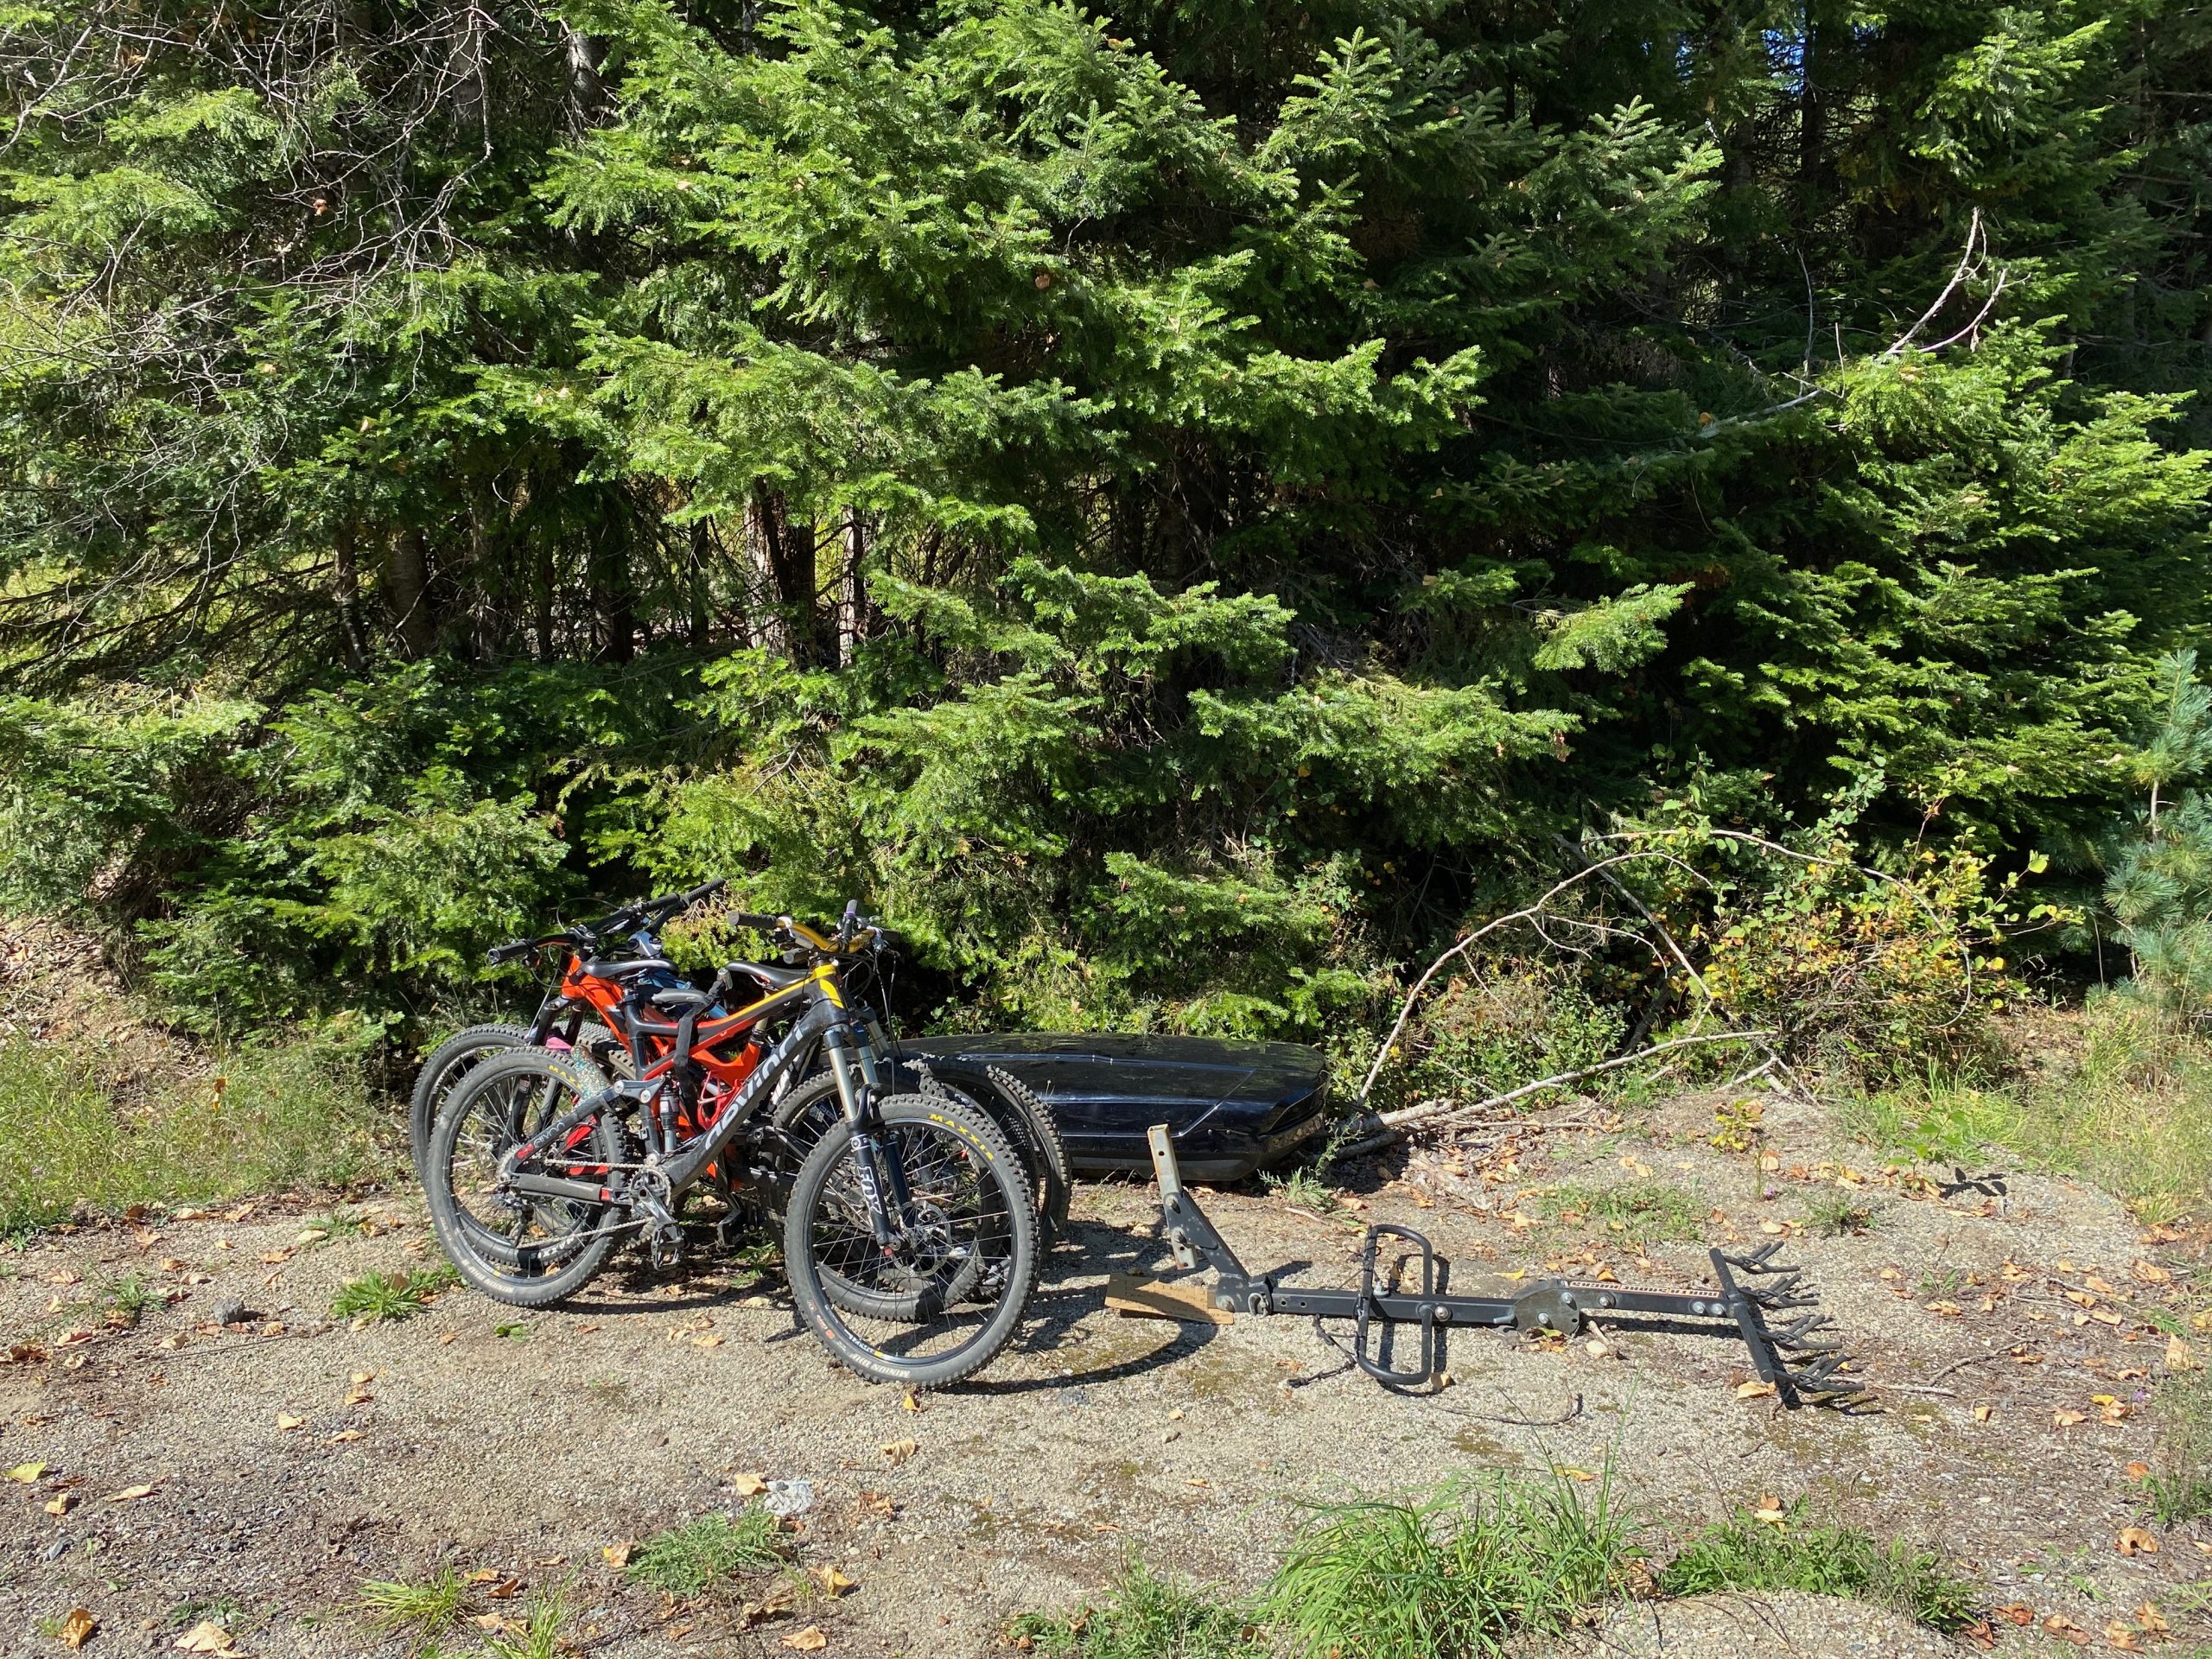
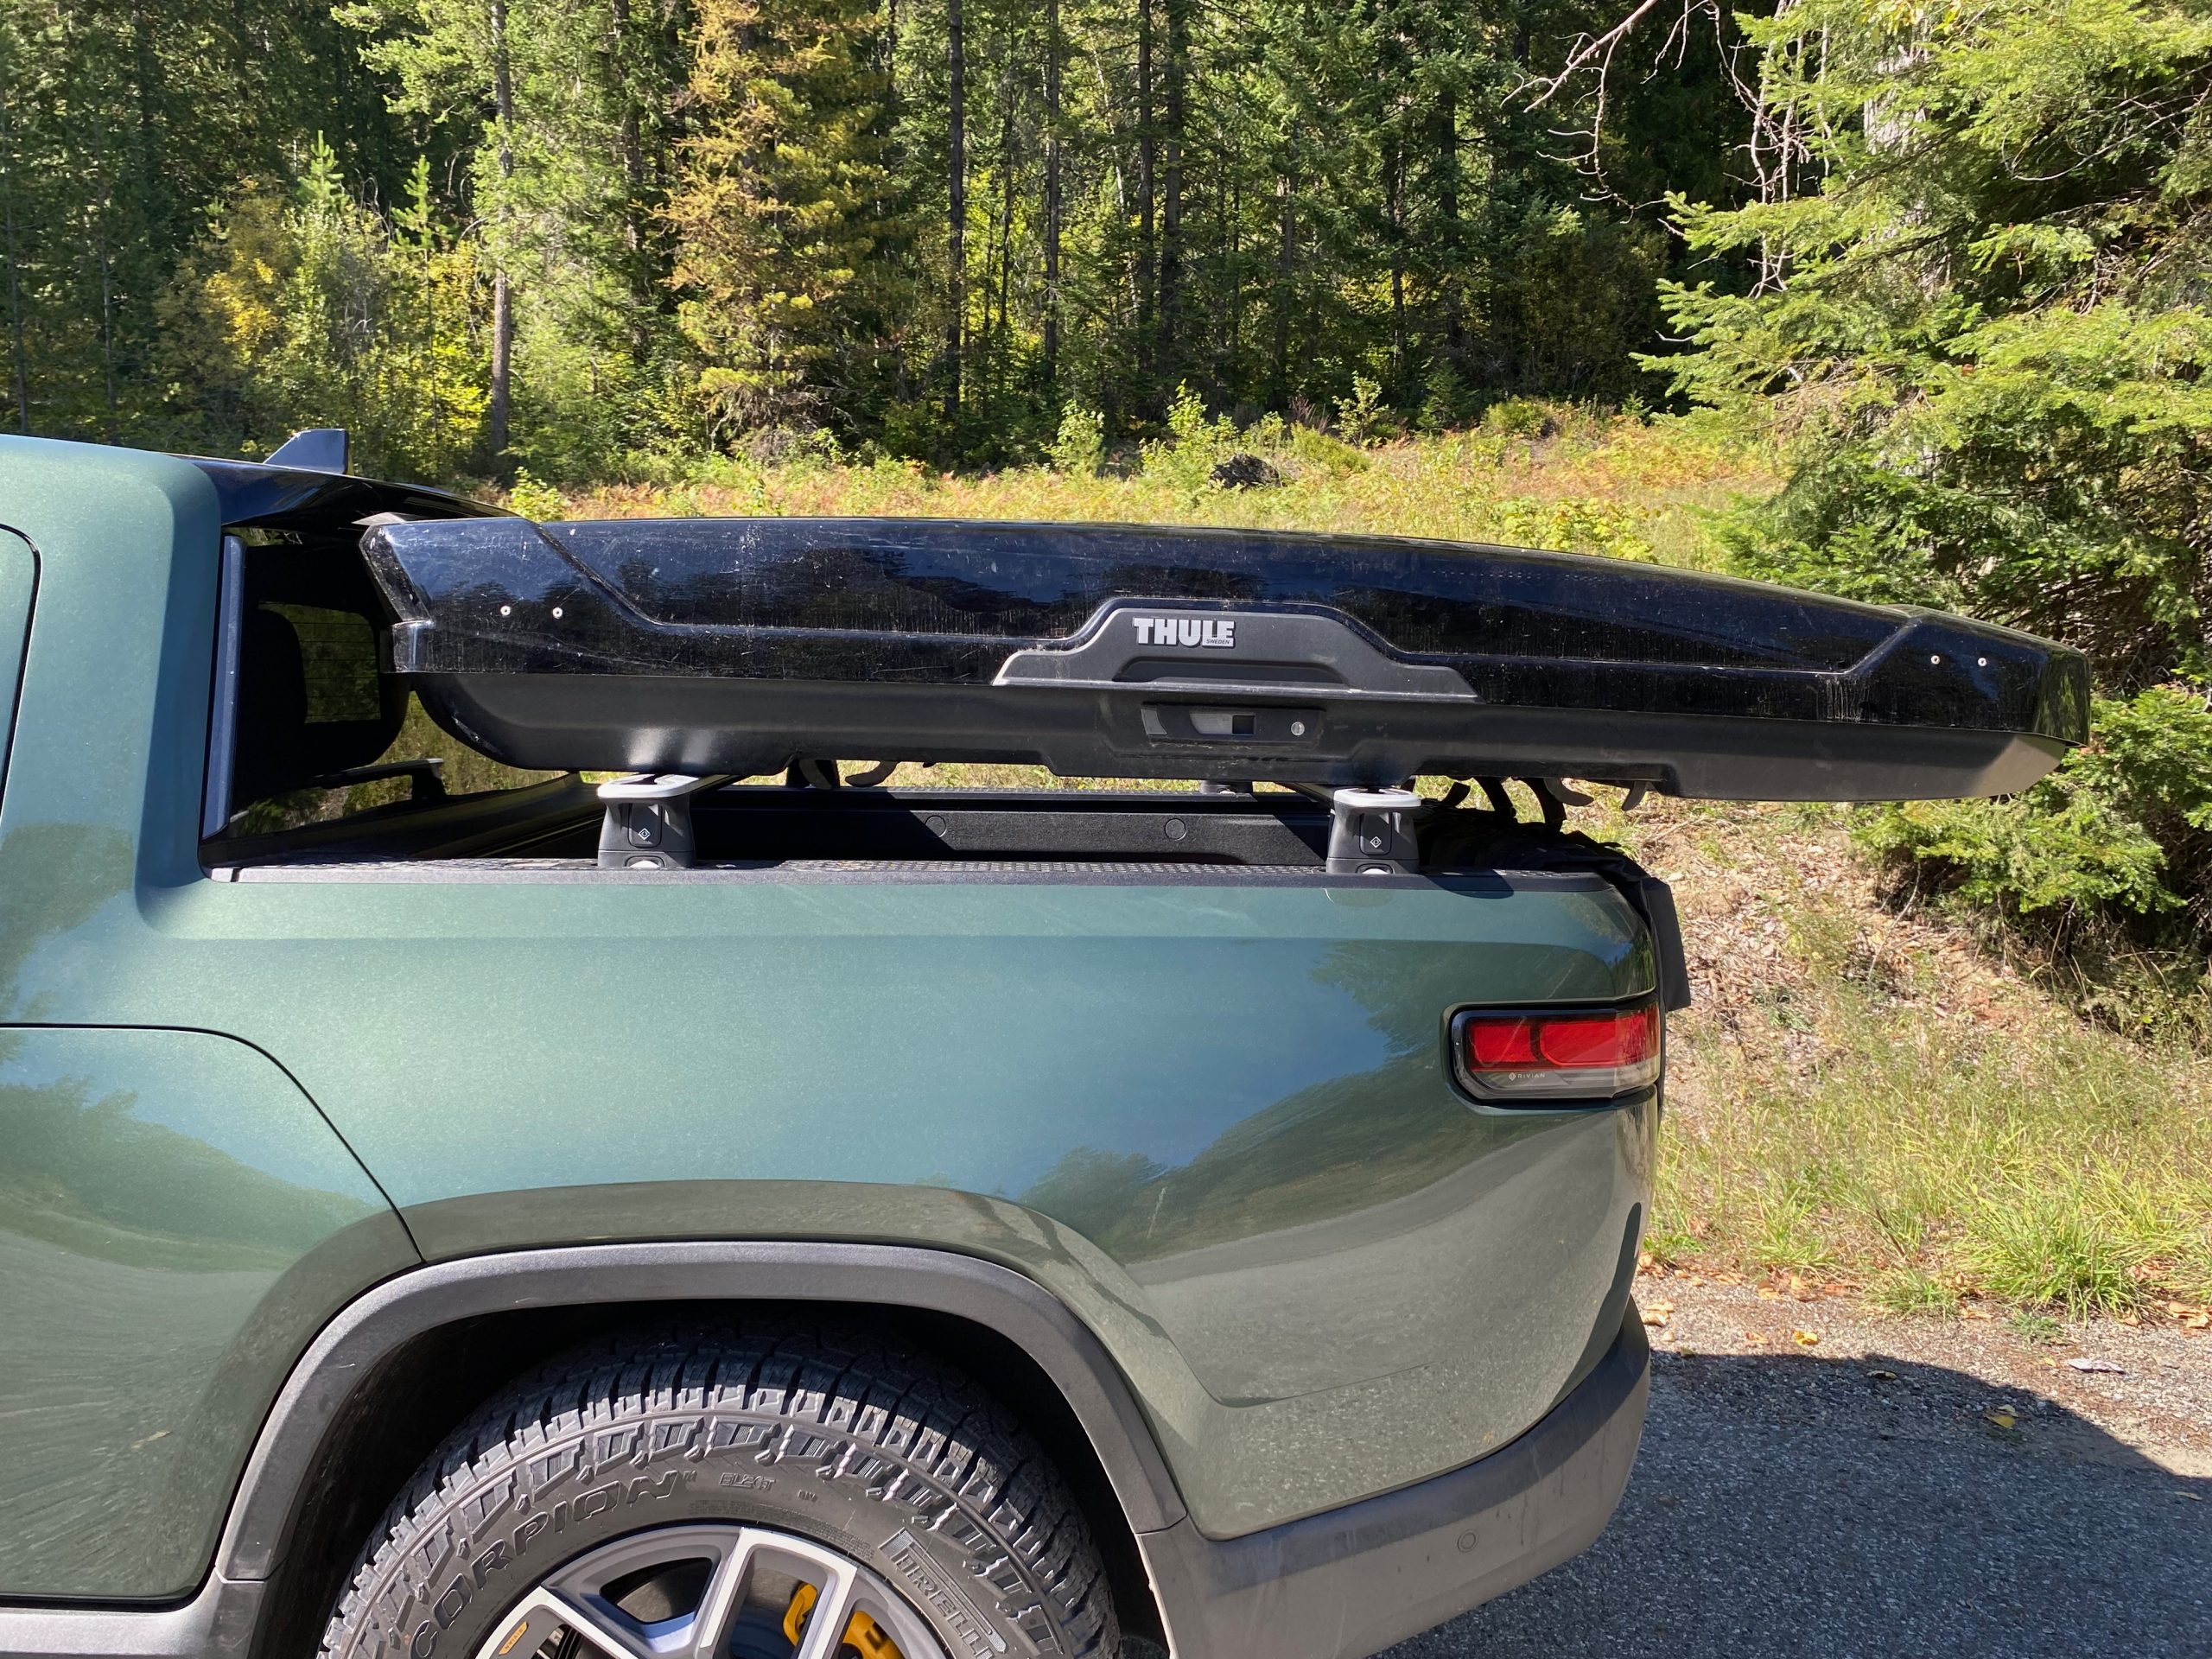
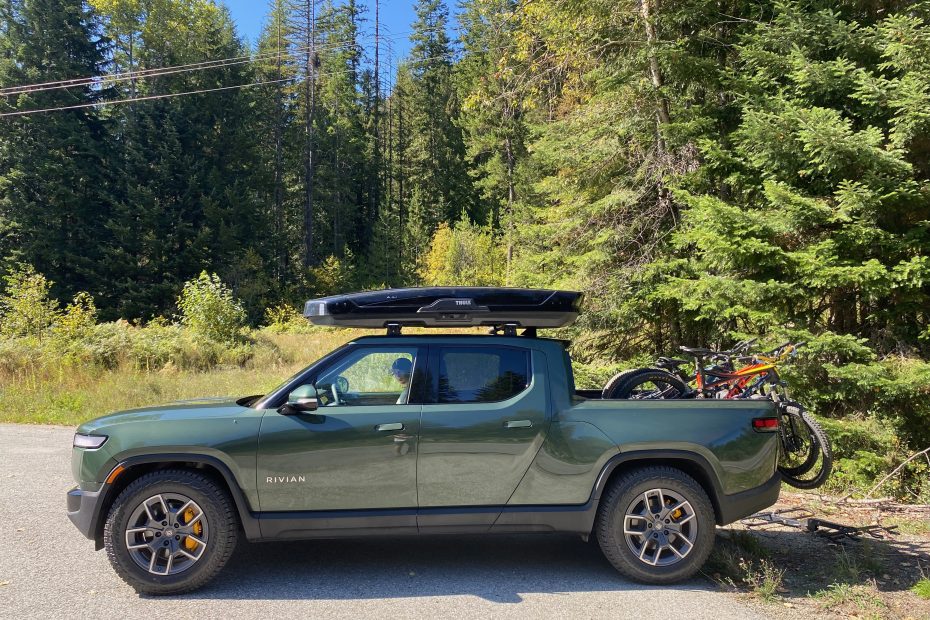
Anyways enough with the nerd stuff – flip through the gallery above to see the test scenarios. I did forget to take a picture of the bikes on the Northshore Rack on the hitch, but you’ll see it laying on the ground for photo 5 haha. We had also intended to complete two other tests on the same day: the 1st with a paddle board mounted on a kayak rack, but the rack feet couldn’t expand enough to go over the bars (which is kind of funny because they are both Yakima products); the 2nd was to mount the ski box on the bed (I have a hunch it will impact efficiency less there) – unfortunately my particular box is quite long, at over 220cm (7.25 feet) external dimensions so we couldn’t complete this test. (If you have a shorter box and are interested, I’m interested in checking, get in touch!)
Results are in the table below (for km/kWh, higher is better [i.e. more efficient]; the opposite for Wh/km):
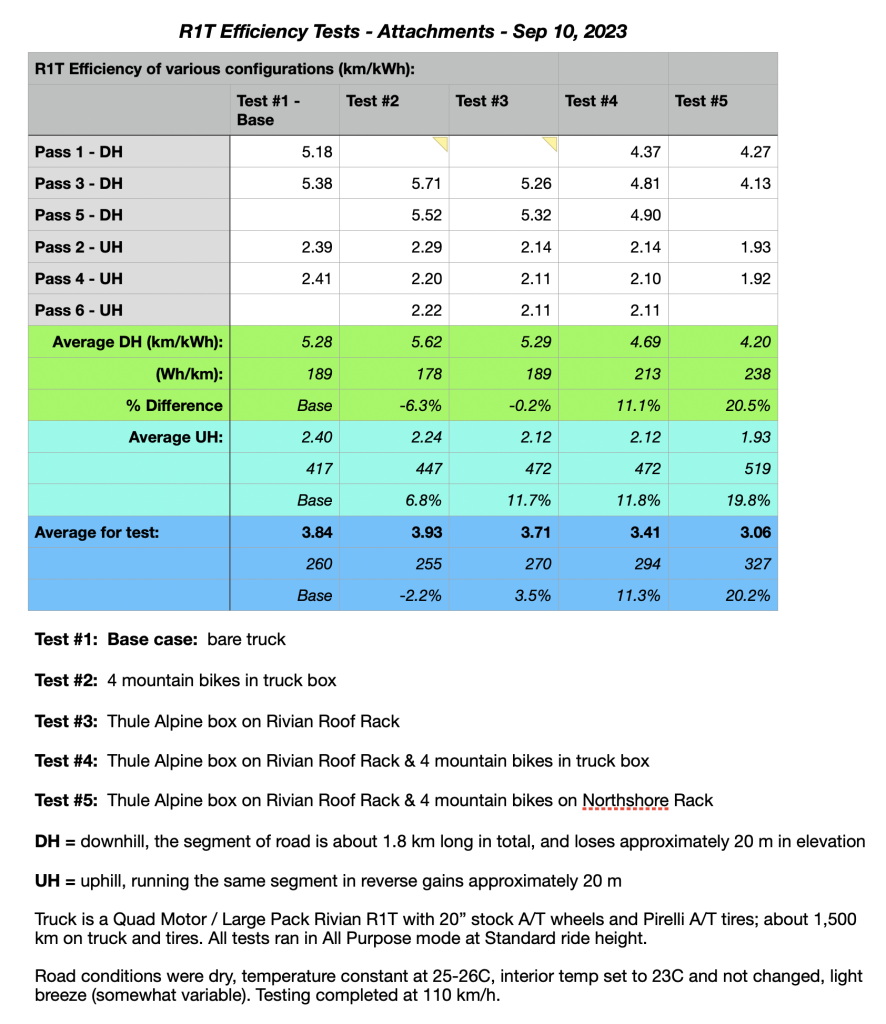
So, first off, I want to run test #2 and #3 again, as something is obviously wrong with that data; in previous testing with the Tesla, I’ve seen the % difference similar between uphill and downhill runs, but for these 2 tests, they are quite off! But looking closer, the 3 runs I did in the uphill direction are pretty tightly clustered, so I suspect the uphill data is correct (or at least very close), while the downhill data was REALLY off for the first reading, so much so that I threw it out. I suspect that I was initially resetting the trip meter too soon after setting the test speed, but I didn’t figure this out until part way through test #4. I don’t think this affected the data much on the UH leg, but it did on the DH leg.
I have to say, I’m pretty happy with these results! I had suspected that the impact to efficiency would be less as a % than on the Tesla, but to have it also be less incremental increase in Wh/km was a result I wasn’t expecting (table below). The best part of this is that this isn’t even apples to apples – if you consider that the Model 3 + ski box + bikes has about the same cargo capacity as a R1T without a ski box + bikes in the truck box, the number is even better! Clearly the Model 3 (and Y for that matter) are targeted at a different design brief than the Rivian R1 series (and the forthcoming R2), and they really pay a penalty when you add attachments/gear that is really common in the outdoor enthusiast areas of Canada.
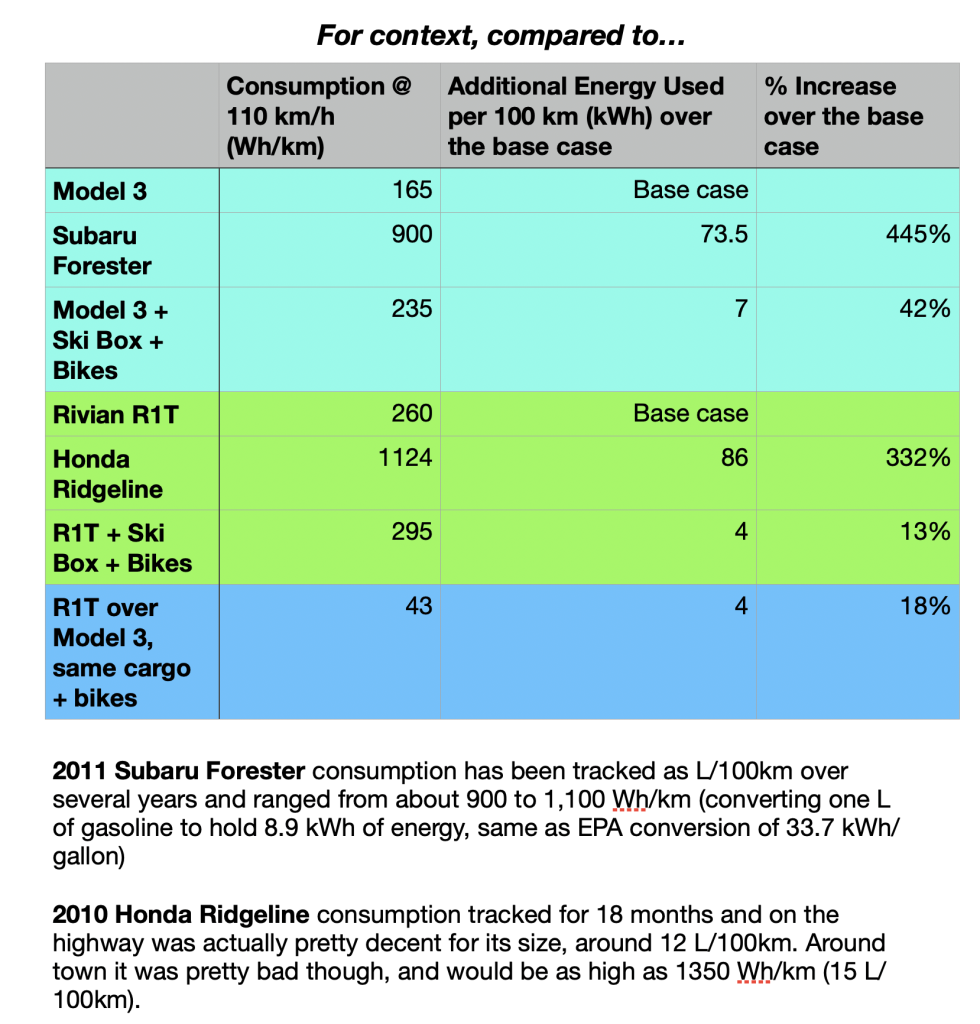
Just for fun, I compared how much more energy our previous ICE vehicles consumed to do the same thing (I didn’t include a Prius here, but it is about 425 Wh/km on the highway… over 60% more energy use than my electric truck!) – yep, ICE vehicles are shockingly inefficient.
So what would I use this data for? Primarily I use it when planning out trips in A Better Route Planner. For the Model 3, this was an absolute necessity because the in-car trip planner, while it works great for “bare” cars, is horrendous for cars with anything attached that impedes efficiency – the planner never adapts fast enough and just keeps adjusting your arrival range down; to get around this, I would plan the trip in ABRP, then print off a sheet and use that to help me know how much to charge at each stop etc.
I was expecting to need to do the same thing in my Rivian; however, shortly before we took delivery, Rivian announced they were purchasing ABRP and integrating their planning software into the truck! I completed the above testing only 1 week after taking delivery, so hadn’t really tested the trip planner yet – so on the trip home I decided to test it out (note: I had just completed Test 4, and driving home we were basically in that configuration, just with the rack added on but with the bikes still in the box).
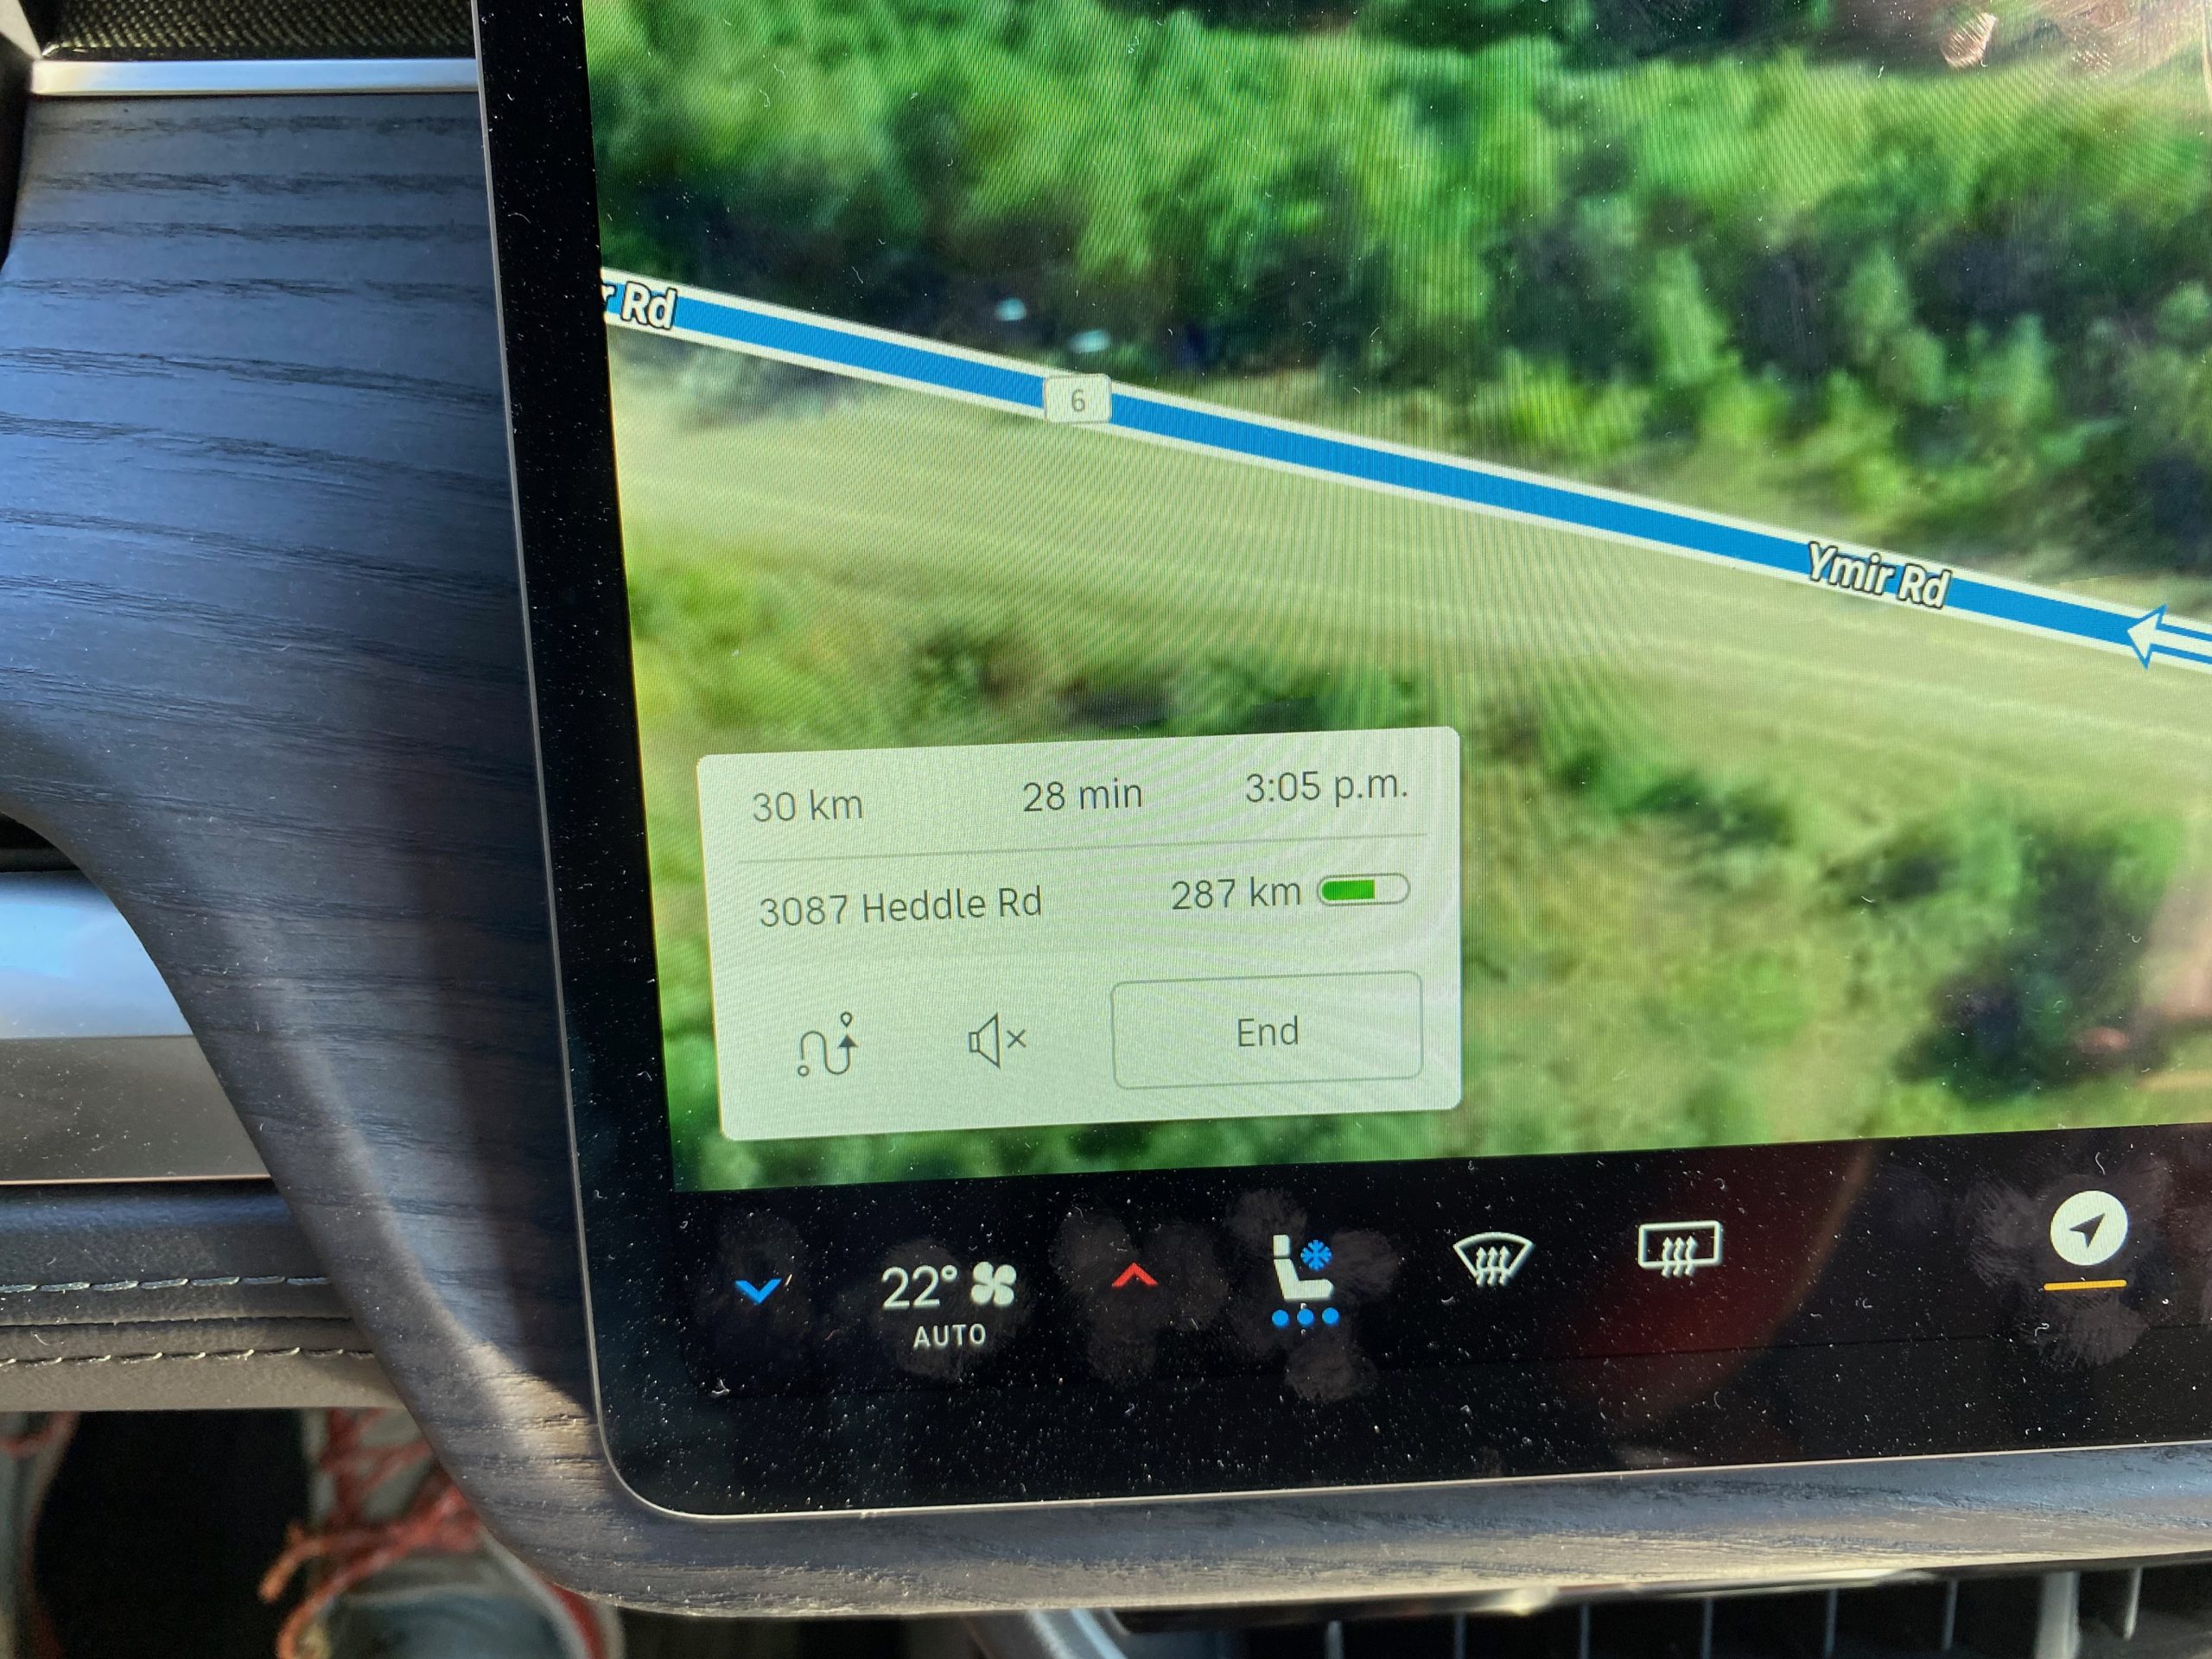
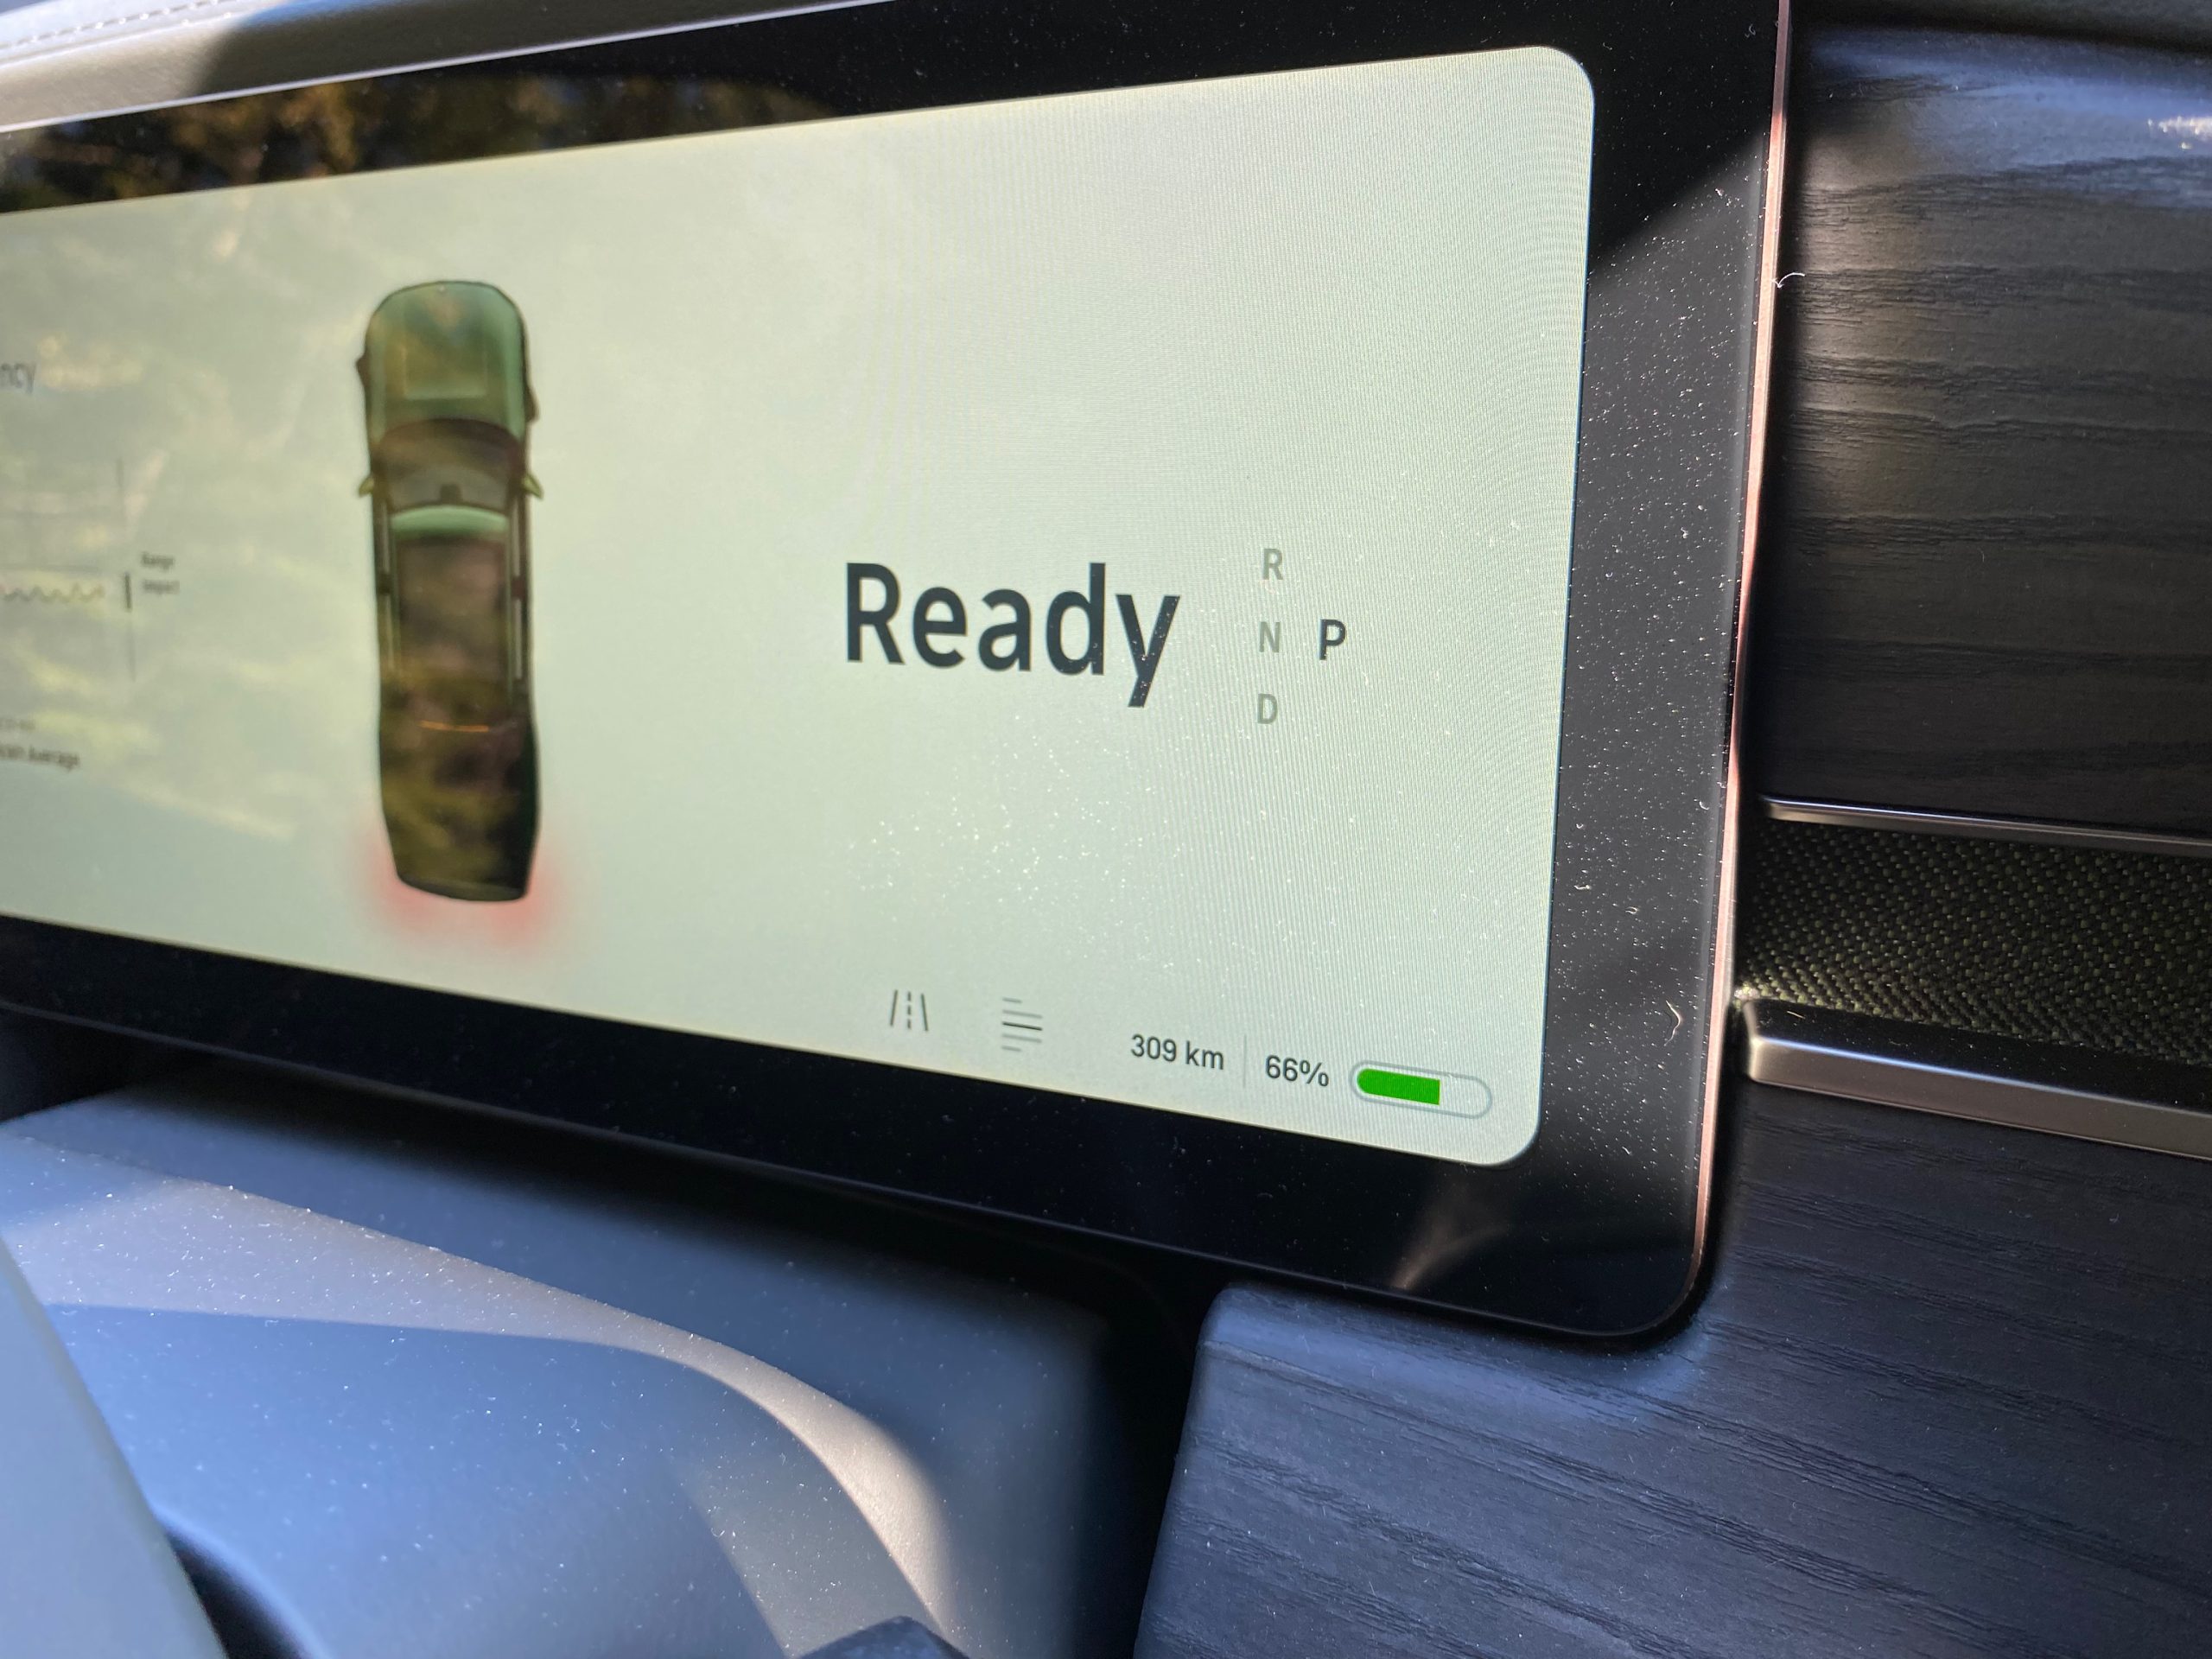
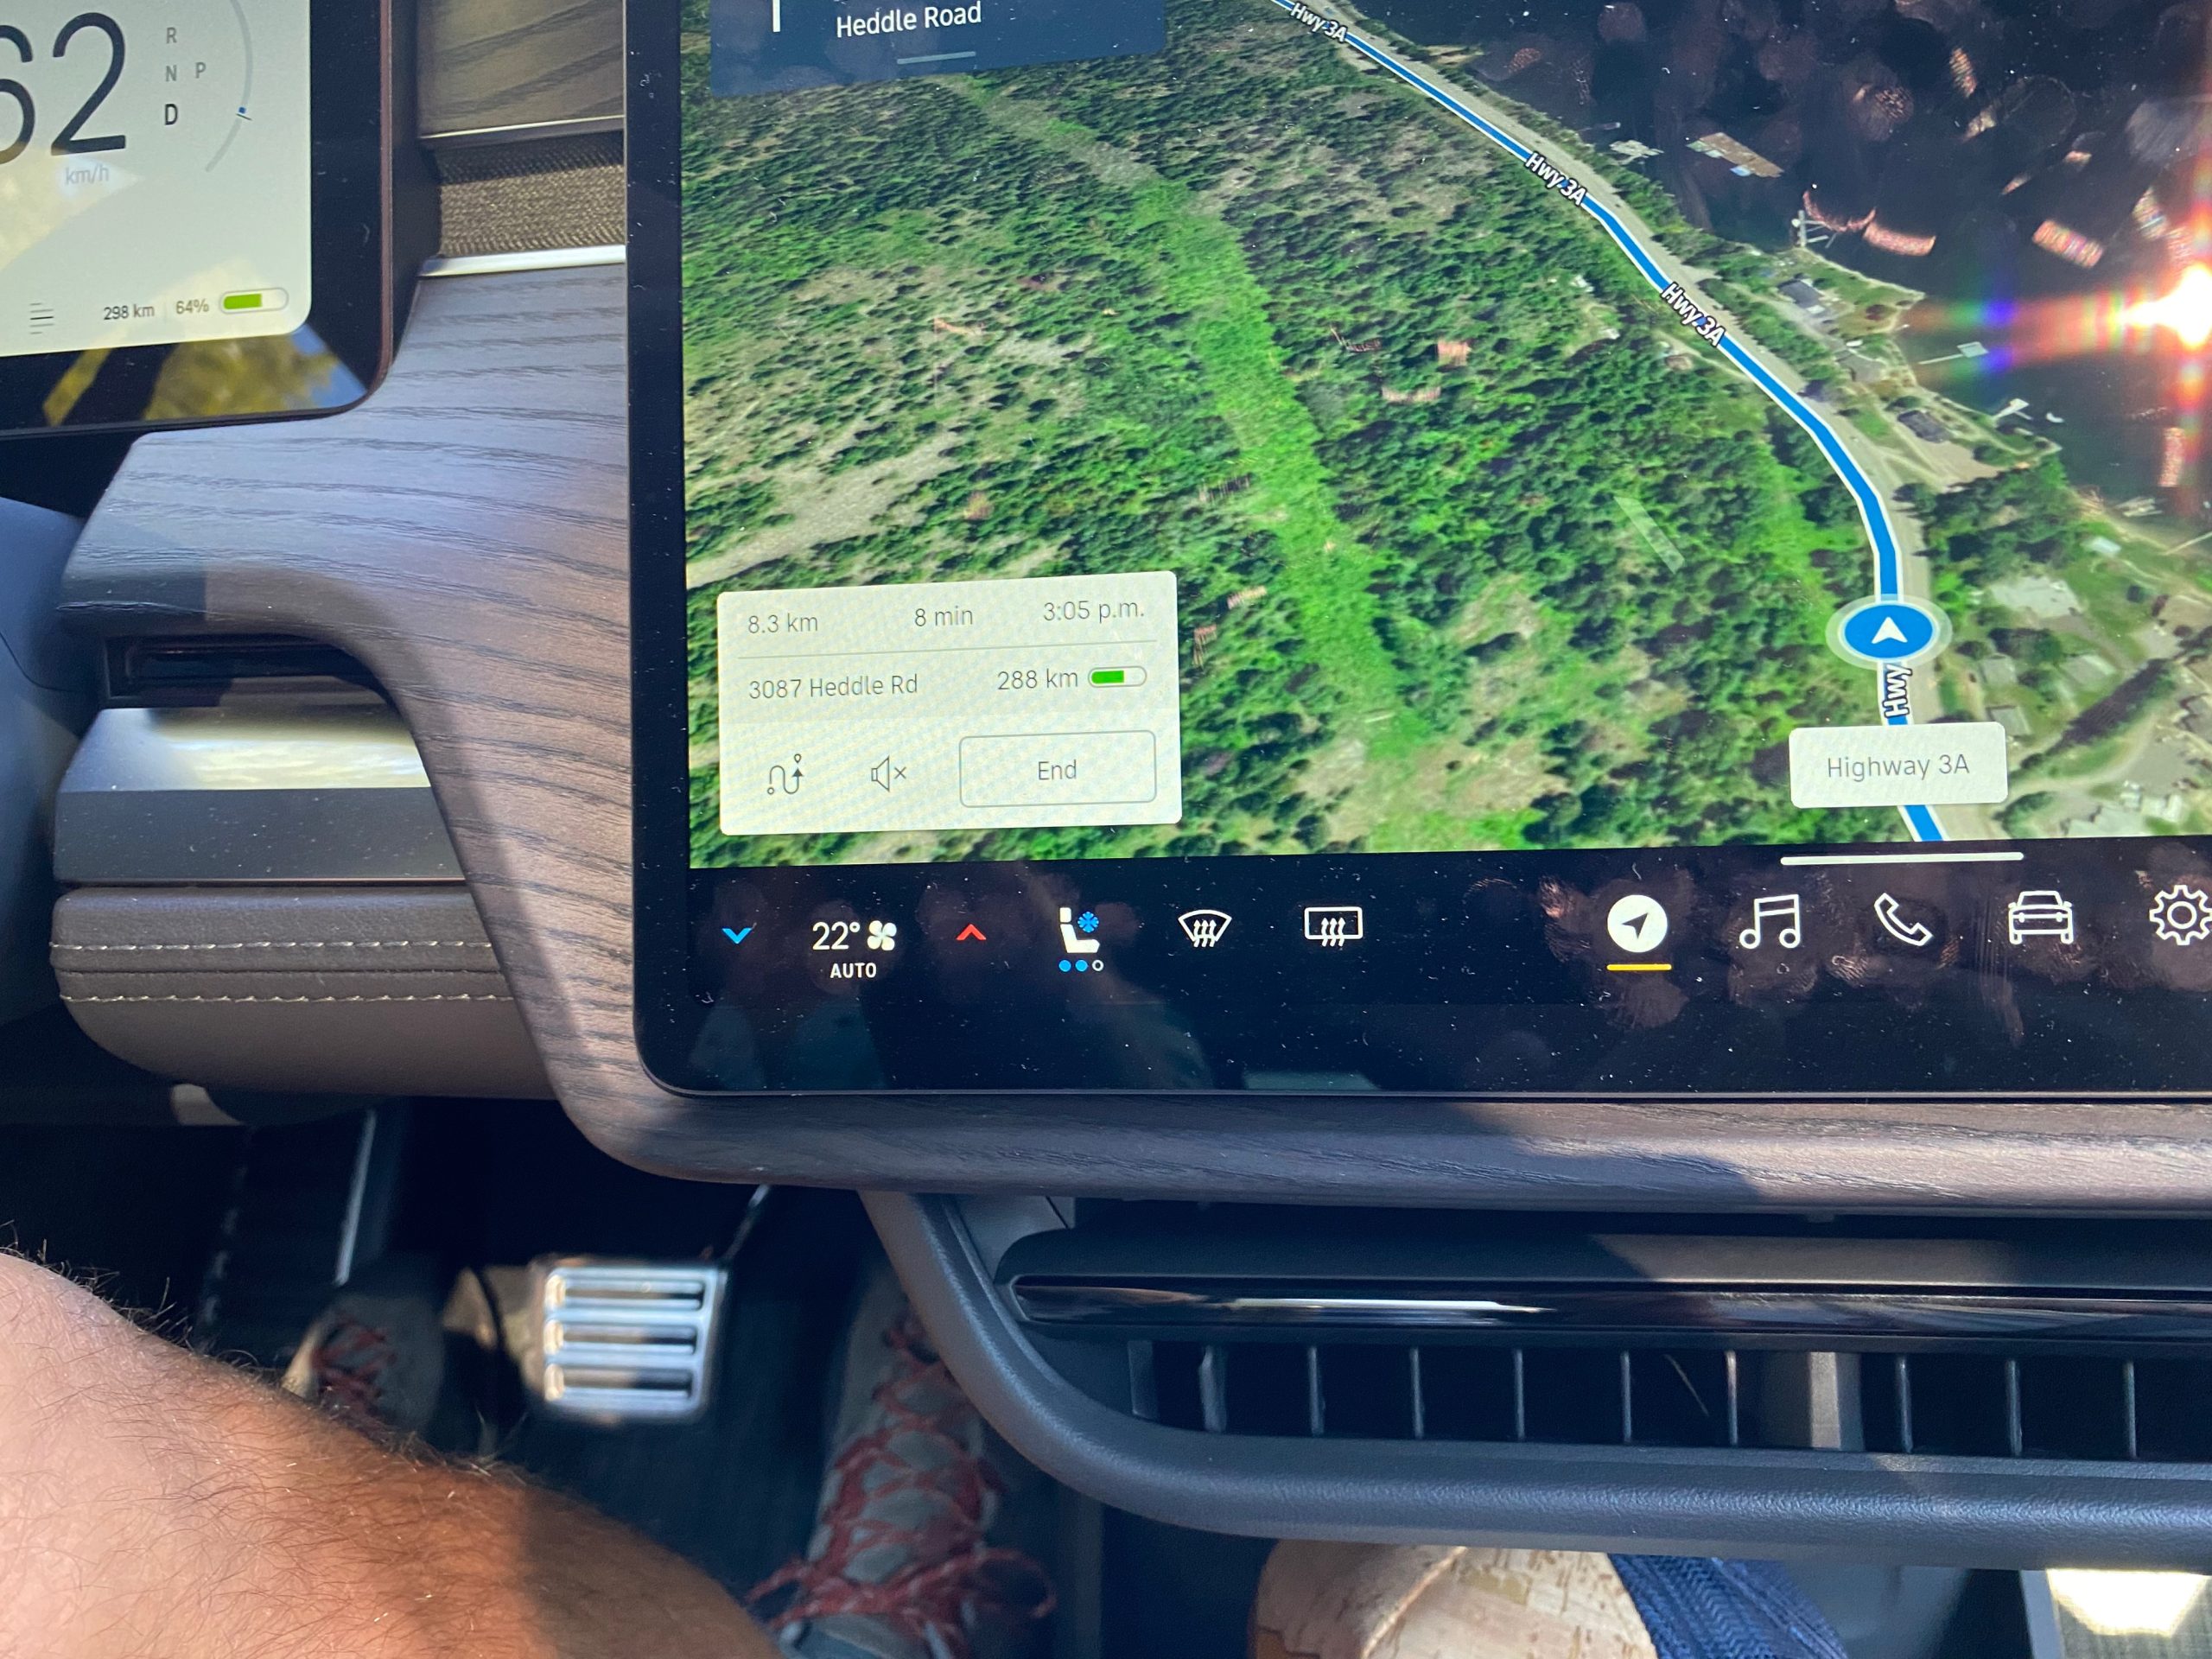
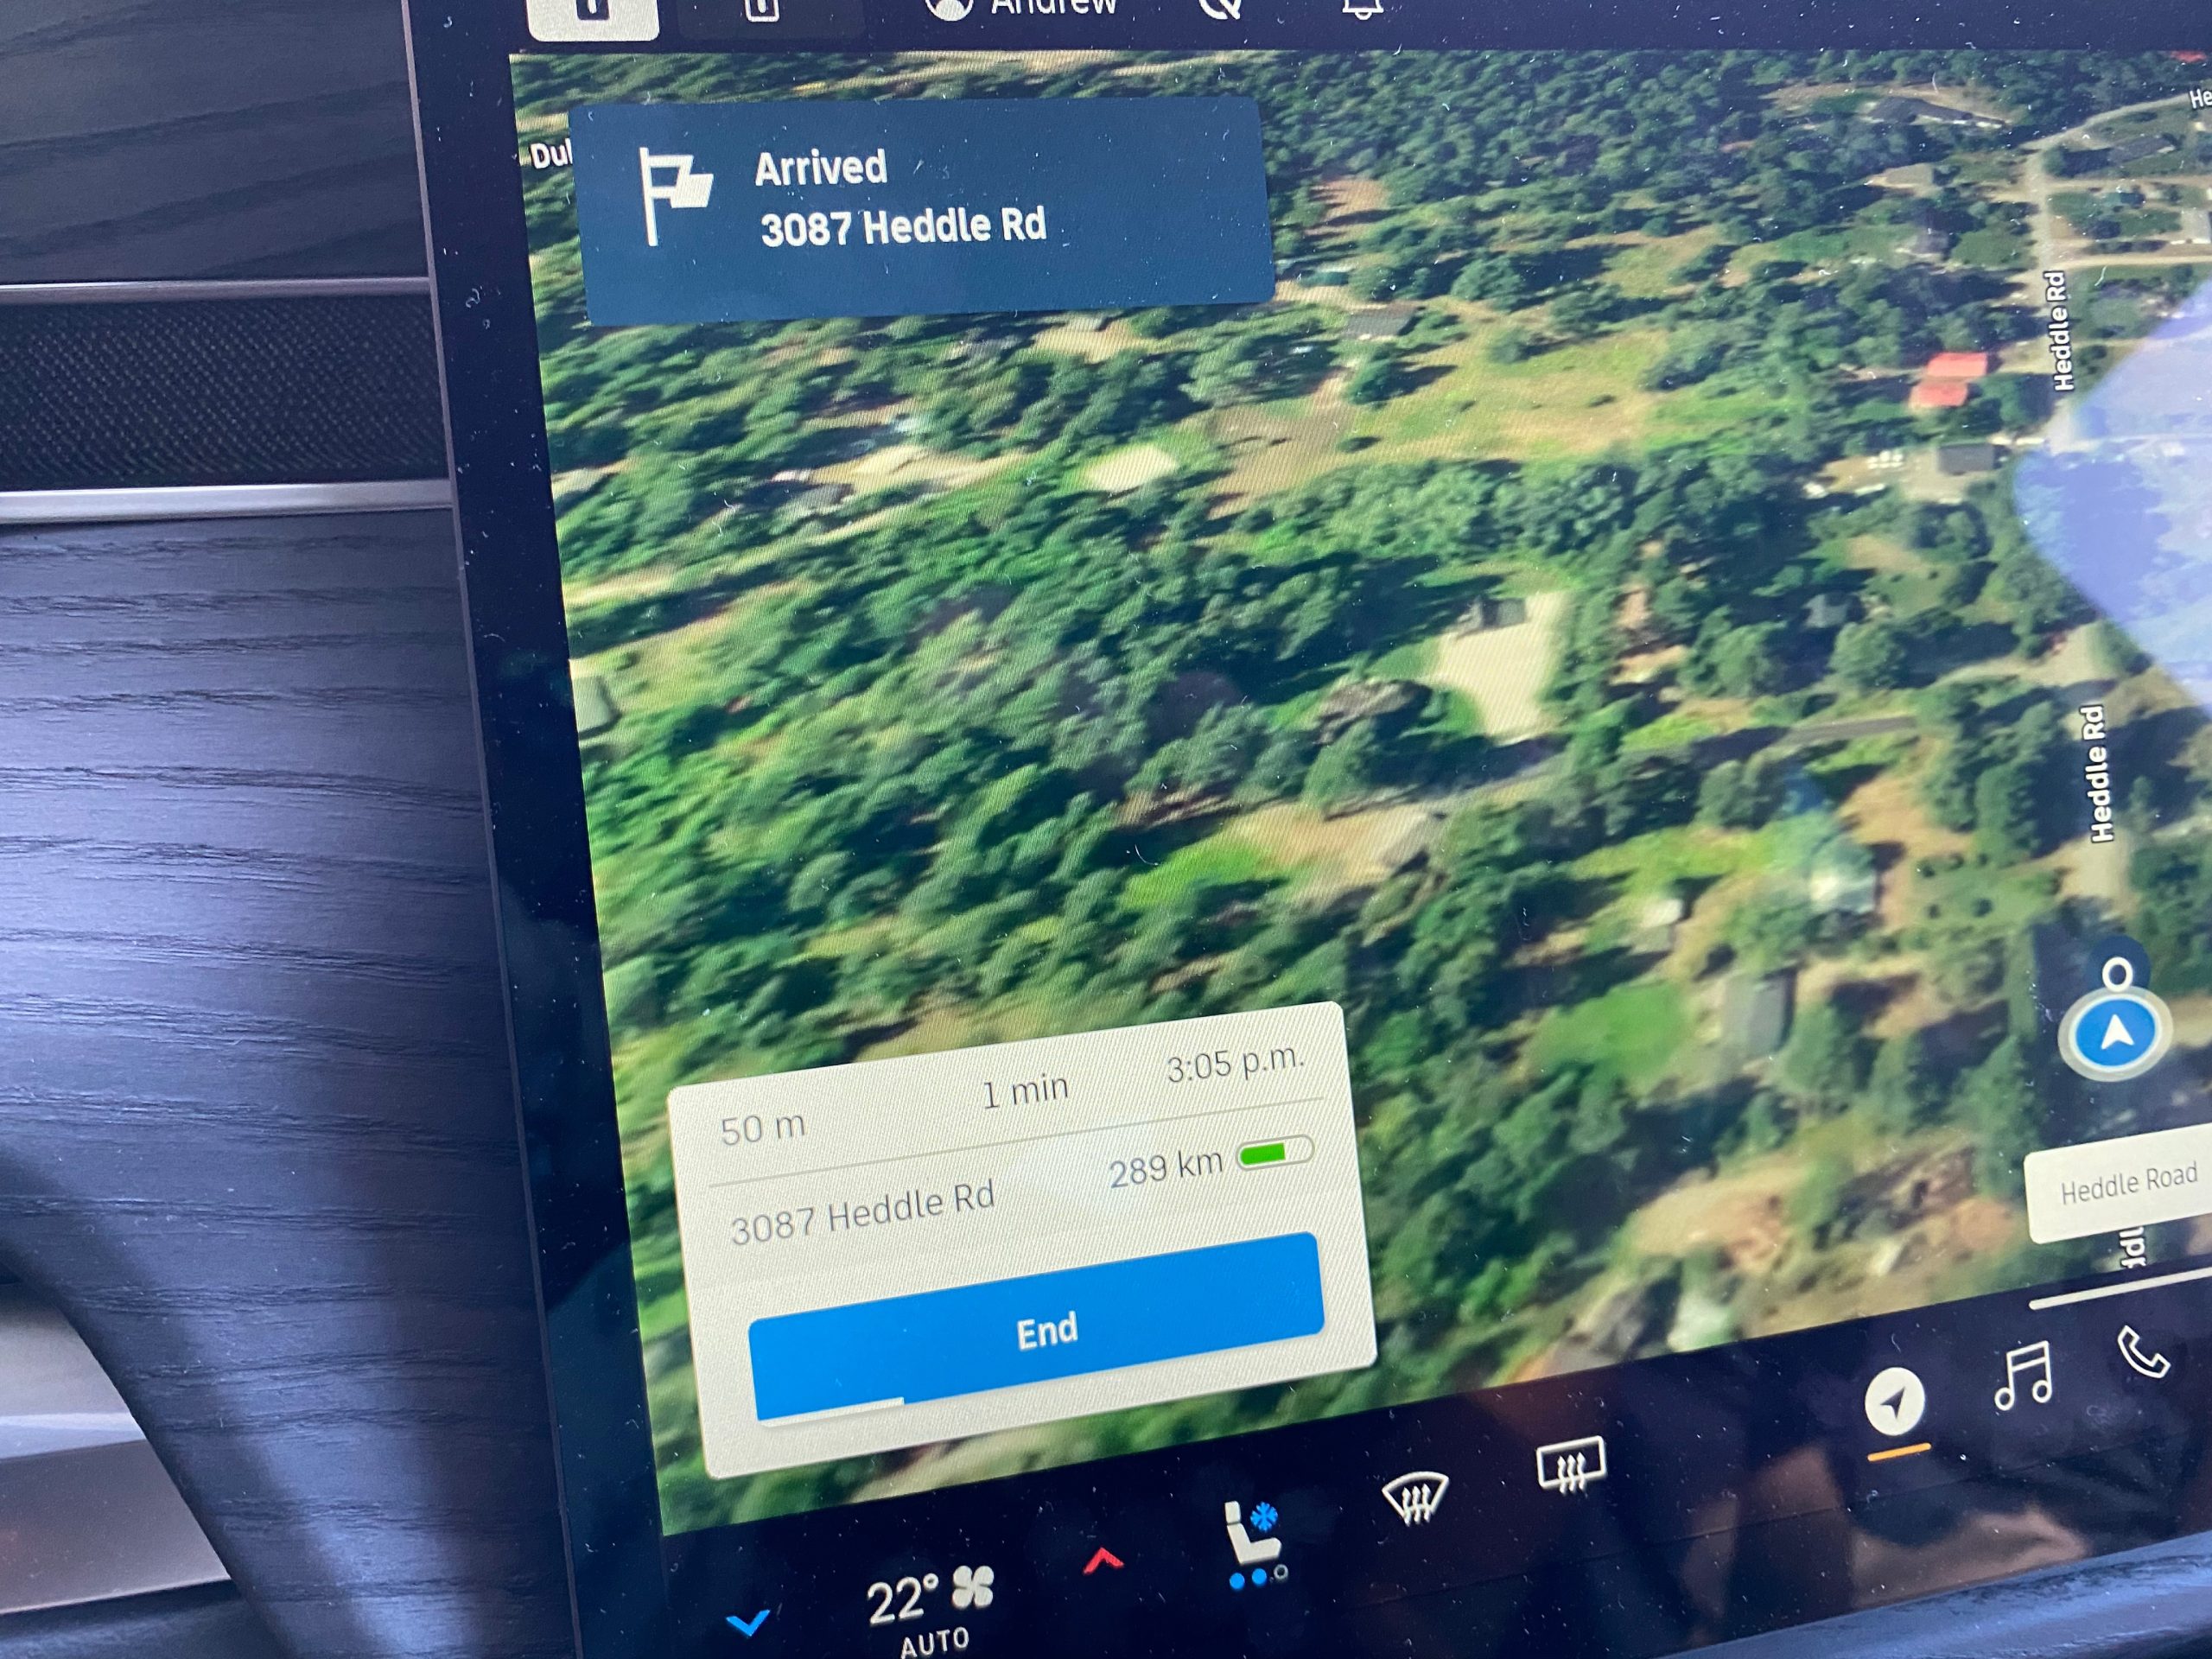
30 km later it was essentially bang-on! It was actually slightly better than predicted. Well that was interesting!
So what has this meant in practice over the last 6 months? We’ve taken many different weekend trips all through the fall and winter, some with bikes, some with the ski box, some without, and it’s amazing how accurate the built-in trip planner has been. The result is that I’ve been relying less on ABRP before I leave on a trip and just trusting the truck to figure it out for me.
What would you like to read about our experiences next? I have some data from a few towing trips in the fall, other efficiency tests I completed already, I could give my 6 month review… let me know in the comments below. Cheers!
He is very passionate about the future of energy generation & usage. He prefers bikes & buses to cars, but acknowledges that Canadian cities have been developed primarily with cars in mind, so if we're going to drive, let's make them all EVs!
- R1T Efficiency Tests: Bikes and Ski Boxes - March 30, 2024
- Adding Outdoor Accessories to my R1T - December 1, 2023
- Why an EV truck? Why the R1T? - October 8, 2023