
The title image is one of many places we have been able to travel to solely on electric power, thanks to our 2014 Nissan Leaf! Here we all are at Kokanee Creek Provincial Park:

-

- The view east on the West Arm of Kootenay Lake, February 2015

Rolled over lucky 27,777 km in February 2015
I rolled over 27,777 km on our EV in February. I happened to be at a safe spot so was able to pull over and grab a picture of the dash. It has been an exciting experience so far and has only reinforced the notion that electric vehicles really are the future of personal transportation.
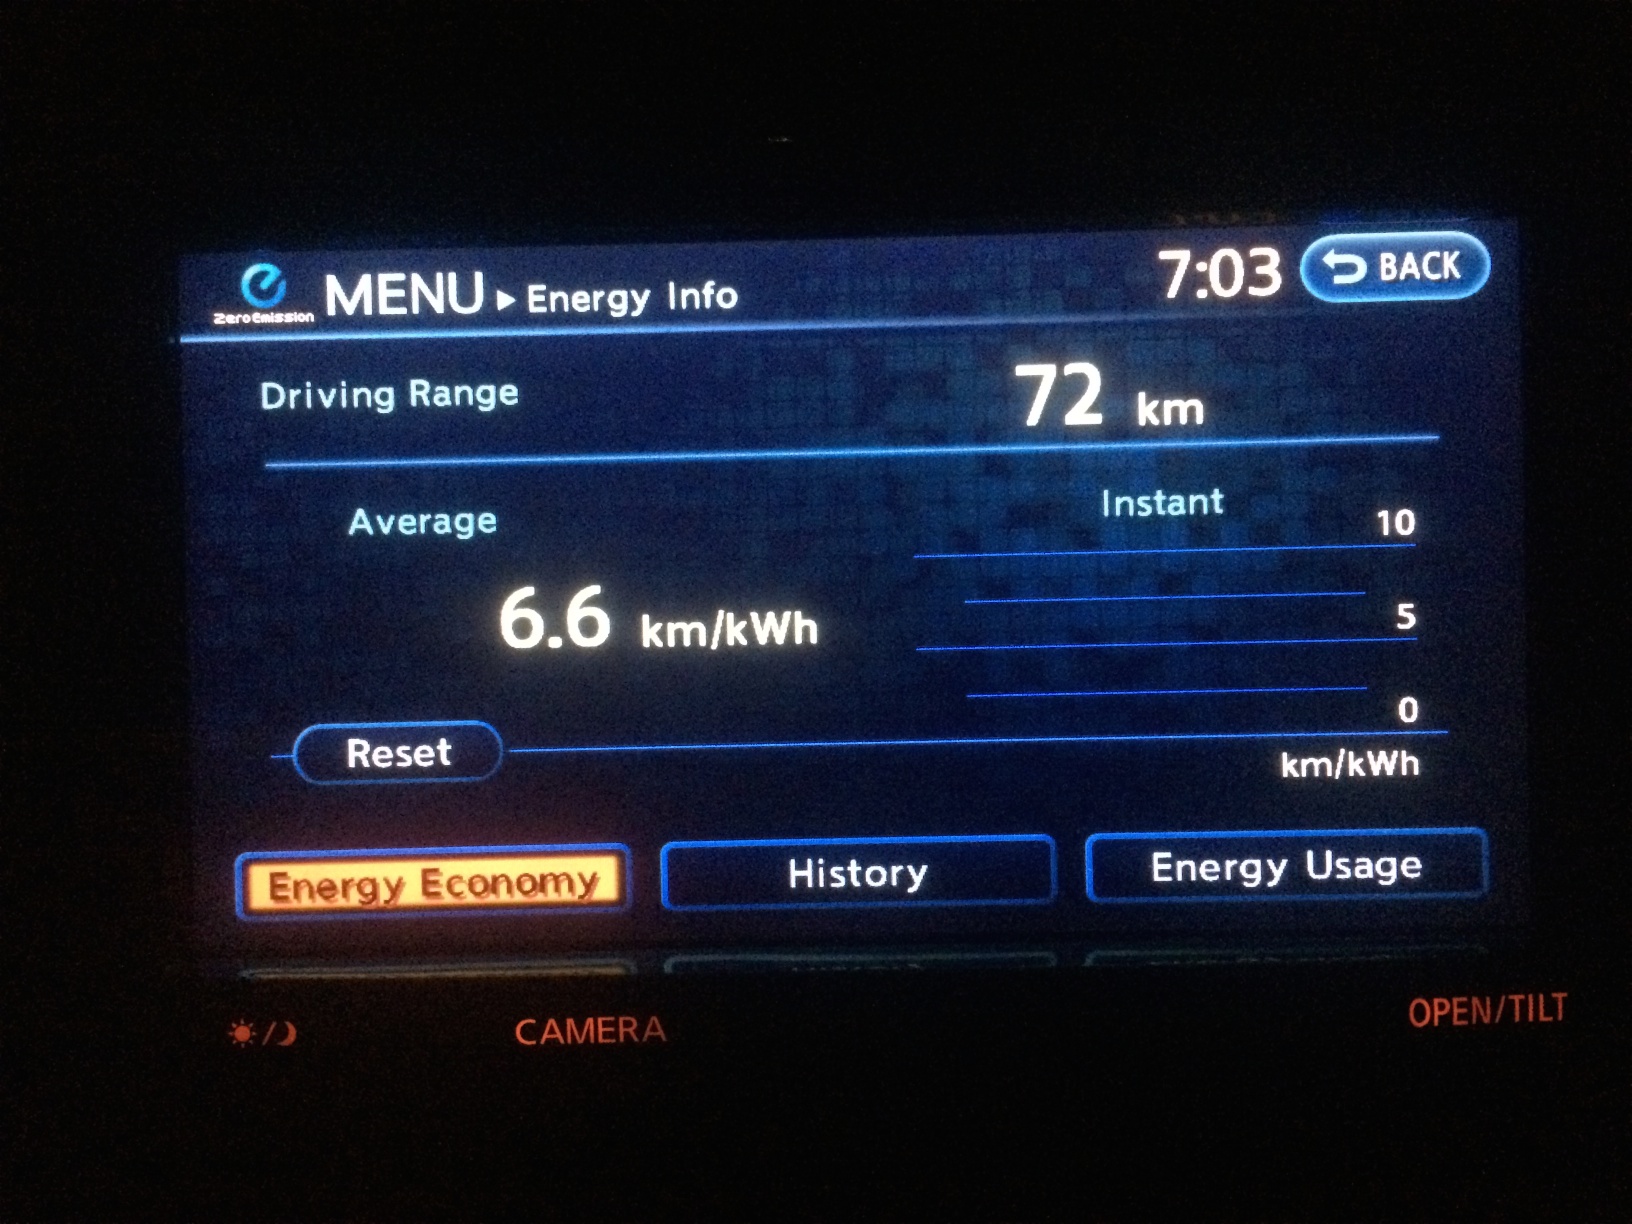
Rolled over lucky 27,777 km in February 2015; this is my lifetime energy efficiency so far.
My lifetime efficiency so far is 6.6 km/kWh (energy used from the battery pack to move the car), which translates to 1.7 L/100km or 132 mpg! There are some ‘losses’ to charge the battery though, so efficiency is better calculated in how much energy you pull from the grid; average charging efficiency is fairly close to 90%, which works out to ~1.9 L/100km or 120 mpg… still not too shabby!
Ok, those not interested in data should probably flip to another page now… 🙂 I’ve been saving up all sorts of data and am going to unleash some now, starting with our cumulative cost data to own the car so far. Rather than show it in a vacuum though, I thought it would be more fun to compare it to other vehicles that we could have purchased instead. Recall in my first post that we had to add a vehicle to our family, so I’ve put in “apples to apples” vehicles for comparison in the tables and chart. That means no ridiculous comparisons, like “zomg, why didn’t you compare to a Toyota Echo?!!!” I wanted a practical family car, remember? The table and footnotes really include most of the explanation, so I won’t go on about it here, on to the 2014 table (click on it to open in a new tab, and much bigger!):
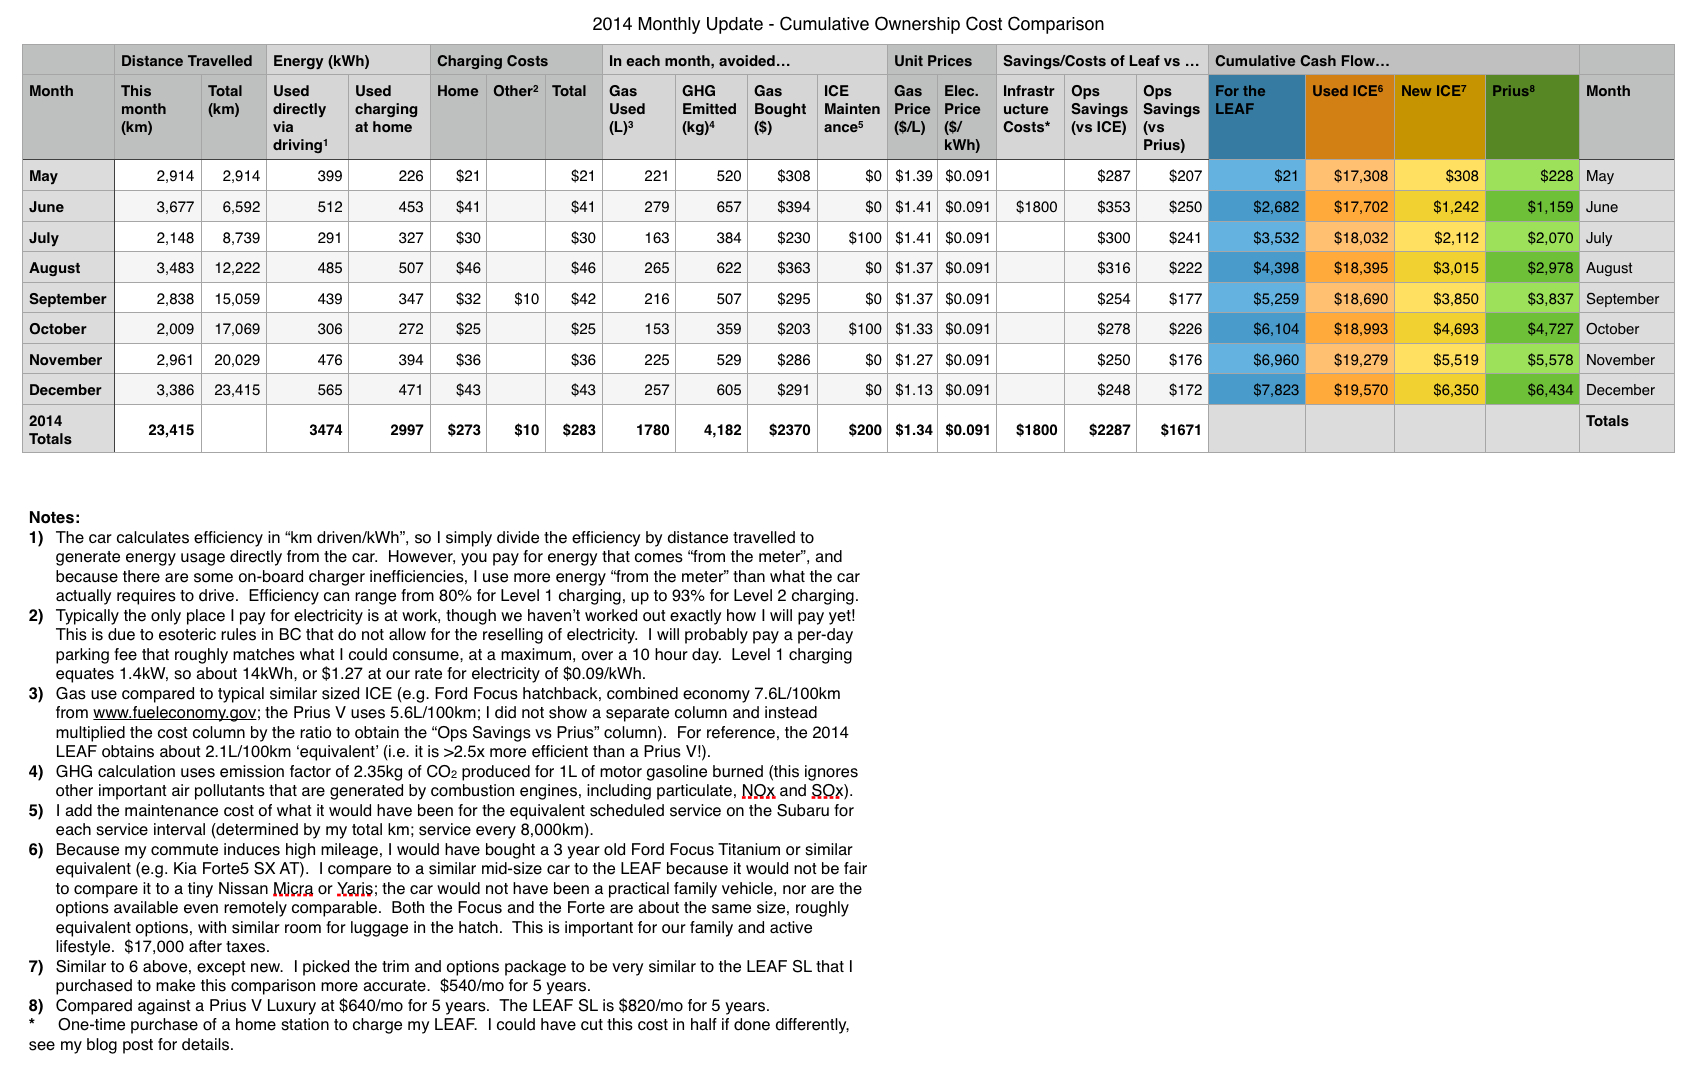
2014 Summary – Cumulative Ownership Cost Comparison
The main thing to point out is that if I had been smarter about installing my Level 2 charging station at home, I would have been ahead almost from the start!
If you compare December 2014 to August 2014, I travelled 3,400km at an electricity cost of about $45 for each month. Gas prices decreased drastically from $1.37/L down to $1.13/L, which did cut into my gasoline savings by $50, but I still saved $250 in the month of December! We all know that gas prices of around the $1.00/L are temporary at best, yet I still save large amounts of money, because EVs are simply cheaper to operate (more on forecasted costs below).
Each month or so I will post an update to the blog. Here is the 2015 table below:
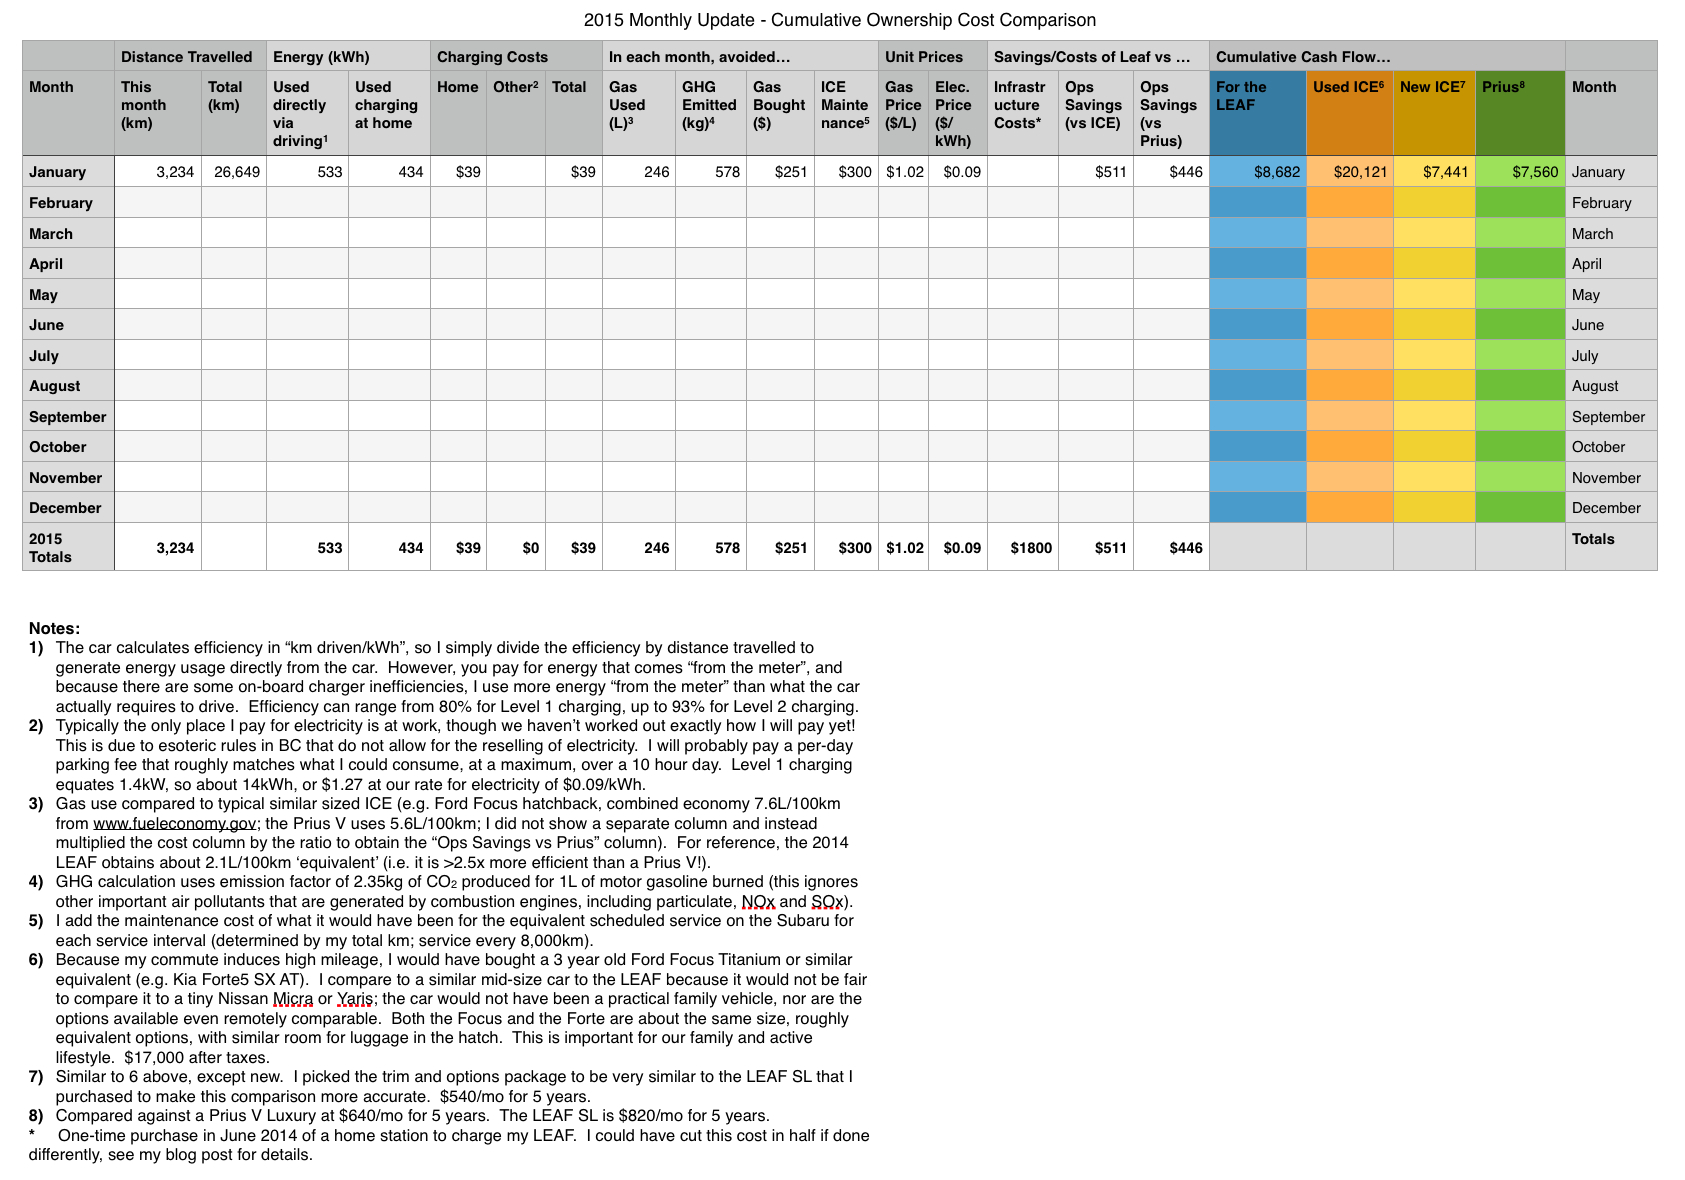
2015 Monthly Update – Cumulative Ownership Cost Comparison
Finally, I thought it would be interesting to graphically show what this all means:
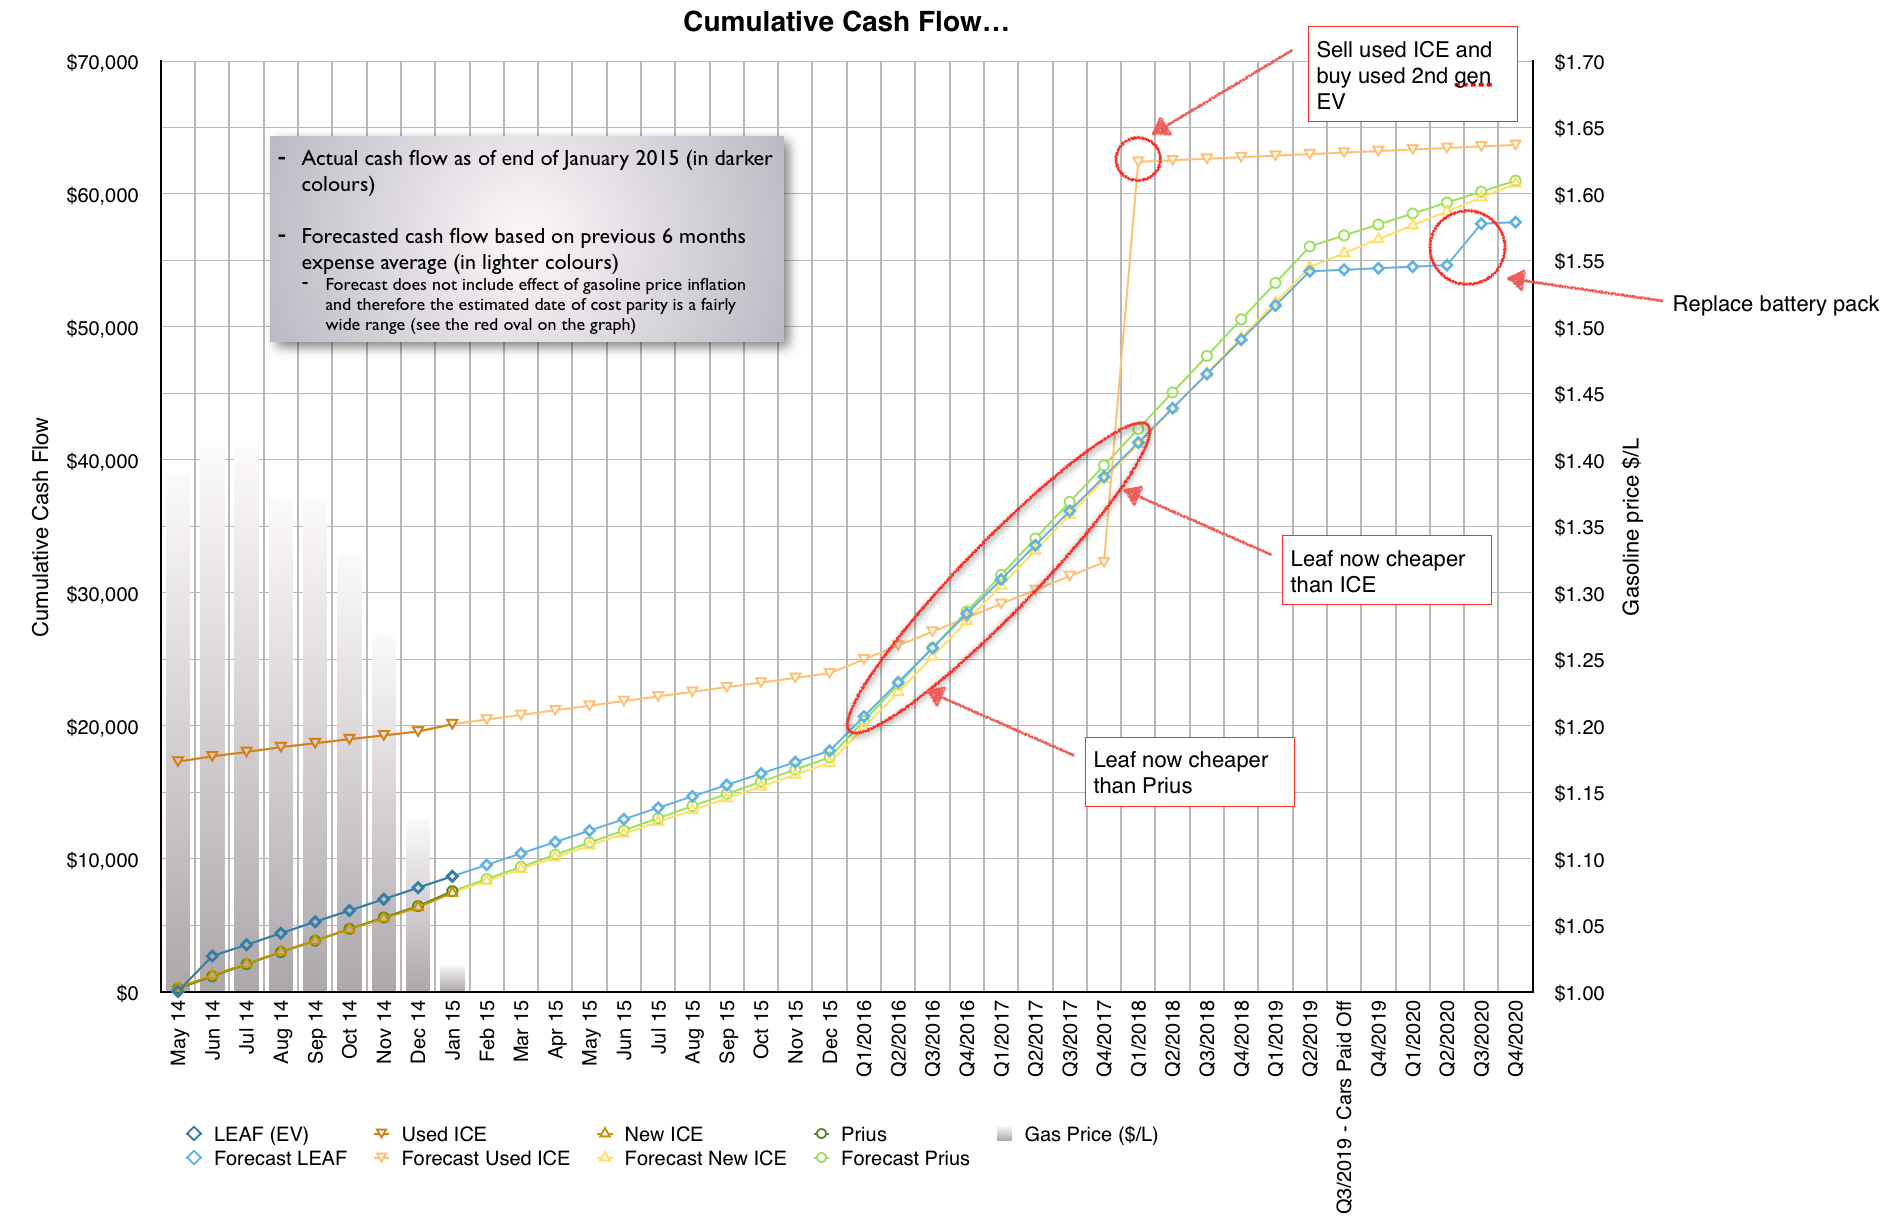
2015 January Cumulative Cash Flow Chart
Despite the higher upfront cost of my Leaf vs a comparable “internal combustion engine” (ICE) vehicle and vs a comparable Prius, I will recoup my cost within a few years, and once the loan payments are finished at 5 years, the cost savings really come into effect, just look at how my EV costs almost flatline vs the gasmobiles. I will have to replace a battery at some point during the life of the EV, which is currently $5,500 (but I expect it to be much cheaper in 2020, perhaps even half), but the savings will easily pay for that, and if I keep the car for the standard 8-10 years, I expect to save in excess of $10k over either of those two vehicles.
I had also considered buying a used ICE initially and replacing it with a used second-generation EV in early 2018, and depending on pricing of the next generation of EVs, and that might have been cheaper long-term, but I really couldn’t fathom in the meantime using over 10,000 L of gasoline, emitting 25,000 kg of CO2 (based on 34,500km/yr), along with 60 kg of nitrous oxides, 90kg of volatile organic carbons, and 0.35kg of particulate matter smaller than 2.5 microns (the size that is hazardous to your health because it gums up your alveoli in your lungs) [data calculated from the EPA], not to mention the $12,500 – $15,000 in gasoline costs, money that goes to fund further tarsands development, or offshore oil extraction, or even fracking (since all of the easy-to-get oil is largely gone, and what’s left is mostly in the Middle East… I don’t think I need to say anymore here.)
If you have any questions on what you’ve read above or want some help figuring out whether an EV or PHEV is practical or economical for your use pattern and life situation, please get in touch with me through the contact form on the About page, I’d be happy to help!
He is very passionate about the future of energy generation & usage. He prefers bikes & buses to cars, but acknowledges that Canadian cities have been developed primarily with cars in mind, so if we're going to drive, let's make them all EVs!
- R1T Efficiency Tests: Ski box on the roof or over the bed? - December 14, 2025
- R1T Efficiency Tests: Bikes and Ski Boxes - March 30, 2024
- Adding Outdoor Accessories to my R1T - December 1, 2023

Pingback: Cost update – 77,777 km and 2 years – Kootenay EV Family
Pingback: Cost update – 96,000 km and 2.5 years – Kootenay EV Family
Pingback: Cost update – 3 years and 117,000 km – Kootenay EV Family
Pingback: Cost update – 3.5 years and 135,888 km – Kootenay EV Family